Despite the fall from 1.27 which sent prices below the rising trendline in play since the start of the year, the bullish uptrend remain mostly intact, with price trading above the previous swing high back in March. However, the first day of trading in June changed that, with prices pushing below the swing high, and touched 1.25 before trading back up again. 1.2525 has since proven to be rather resilient, and will allow bulls to continue seek higher pastures closer to 1.27 as long as this level holds. 1.2525 also has another added significance, as trading above it full invalidates the original Head and Shoulders pattern that was threatening to take shape back in April. Trading below it would certainly not mean that the previous Head and Shoulders pattern is in play again, but nonetheless it is an important psychological level that will open up lower targets such as 1.243 and 1.23 if breached.
Daily Chart
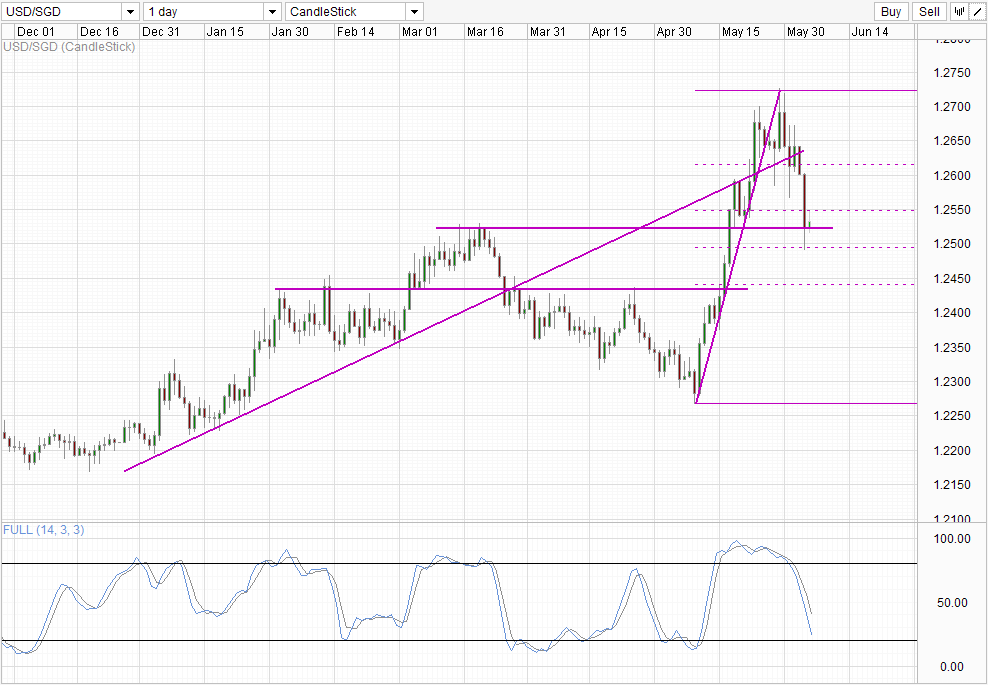
It is also interesting to see that Fibonacci Retracement levels of May rally are also providing important support, with the 23.6% Fib providing the support during the initial retracement from 1.27. The 50.0% Fib stands close to 1.25, while the 61.8% can be considered as the confluence with the 2 shoulders of the Feb – Apr H&S pattern. Stochastic readings are continuing pointing down, with some room left before heading into the Oversold region – suggesting that price has the possibility to head lower a little bit more, which means 1.2525 may be broken in the meantime. Traders should watch if the 1.25/50% Fib confluence is strong enough versus the psychological break of 1.2525, and that could provide us valuable information on the underlying sentiment, and perhaps the trend for June.
Hourly Chart
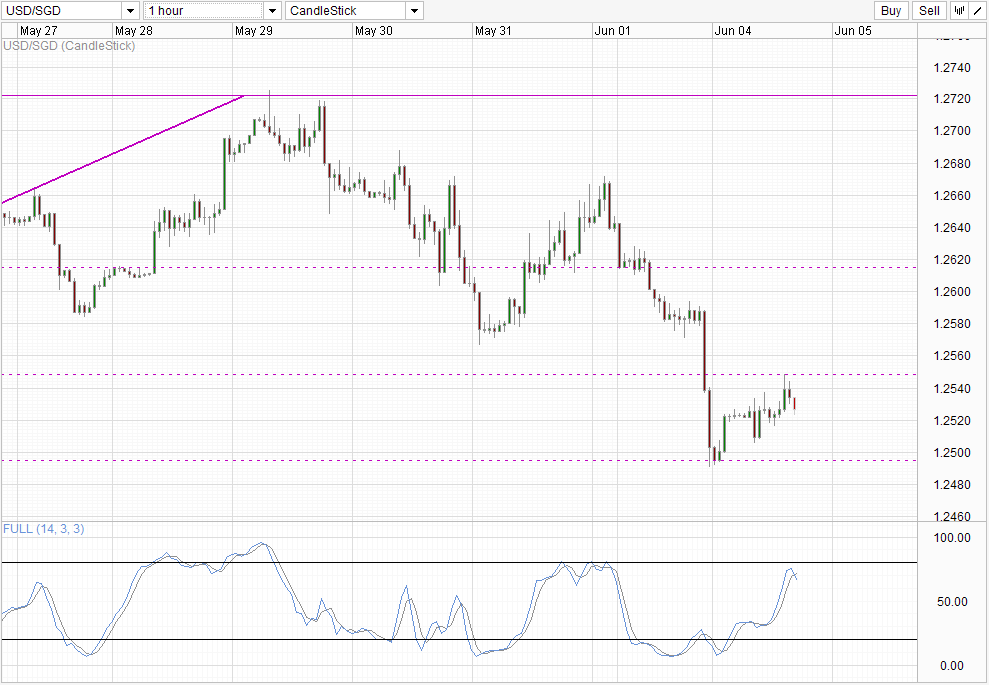
Short-term chart is certainly bearish, with 1.258 support broken, and price is already finding resistance from the 38.2% Fib which makes testing of 1.258 again difficult. With Stochastic readings already looking to peak, direction appears to be heading lower right now, with potential acceleration towards 1.25 if 1.252 interim support gets broken.
With no new economic development from Singapore, USD/SGD direction continue to hinge largely on USD direction. However USD seems to be re-establishing a new inverse correlation with US stocks right now, which would mean USD will continue to weaken as Stocks remain robust. With NFP coming up this Friday, traders can use this opportunity to see if the new relationship still holds after the announcement, and it may be a good indication of how the correlation may work in the month of June.
More Links:
USD/JPY Technicals – Bearish Rejection Below 100.0
GBP/USD – Surges Through 1.53 to Three Week High
RBA Holds Rate – 0.97 safe for now
This article is for general information purposes only. It is not investment advice or a solution to buy or sell securities. Opinions are the authors; not necessarily that of OANDA Corporation or any of its affiliates, subsidiaries, officers or directors. Leveraged trading is high risk and not suitable for all. You could lose all of your deposited funds.

Mingze Wu
Latest posts by Mingze Wu (see all)
- European Bourses Not Enjoying Bullish Winds From US Stocks - 17 April 2014
- More Aggressive Stimulus Possible Despite Premier Li’s Denial - 17 April 2014
- China March FDI -1.5% Y/Y vs +2.05% expected. First decline in more than a year. - 16 April 2014