Weekly Chart
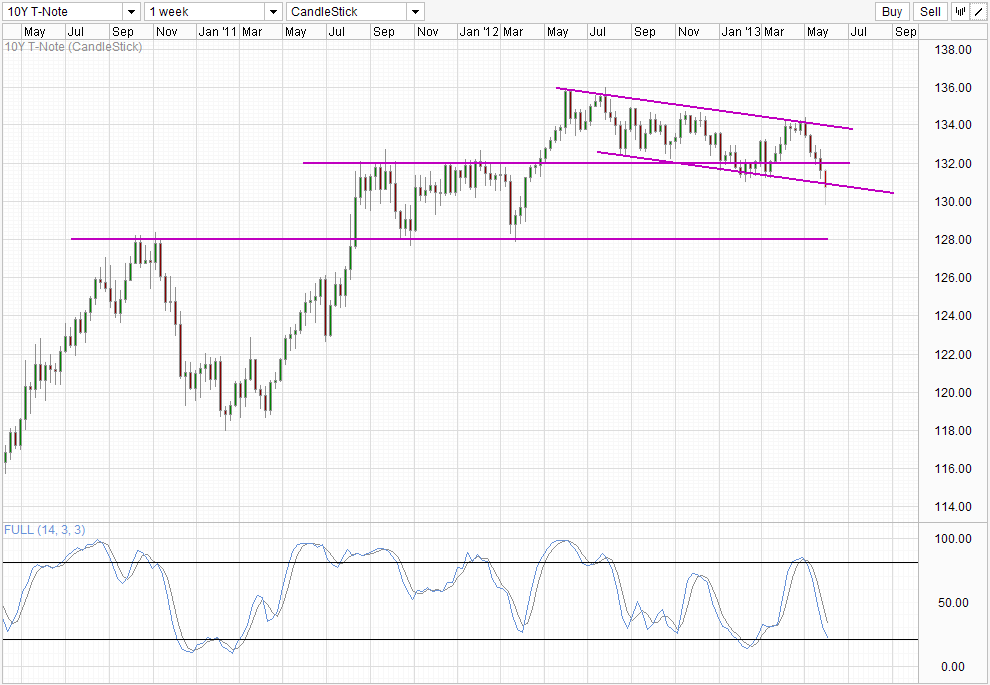
Treasury yields have been climbing up higher (lower bond prices) in 2013 due to the ever rising stocks etching out one historical highs after another. The 10Y benchmark T-Note yields managed to tag 130.0 this week, the lowest in a year, as price broke away from the descending Channel that has been in play since 2012 May.
Current Stochastic readings can be interpreted both ways. Despite not hitting Oversold, price of the 10Y T-Note rebounded strongly, and is currently just straddling along the Channel Bottom, putting the bearish breakout in doubt. If price manage to climb back up into the channel, Channel Top will be a realistic bullish objective, though 132.0 may be able to provide some interim resistance. The bearish interpretation suggest that Bond price may be able to push all the way towards 128.0 considering that readings are still above the Oversold region, with ample space for bears to trade lower.
Fundamentally, there are good reasons both on the bulls and bears sides. Stocks continue to look robust, and that will keep risk appetite high. Furthermore, there has been talks of ending QE in 2013, which will reduce demand for Treasuries. Hence a fall in price towards 128.0 make sense. However, from the short-term point of view, S&P 500 and DJI are both pulling back slightly especially due to the fragility of Japanese stocks. Today is most likely going to be yet another bearish day with US stock futures trading lower after a dismal Asian session which say Nikkei 225 falling by more than 5%. Given such short-term bearishness, a temporary pullback which puts price back within the descending channel sounds reasonable and yet it doesn’t violate the broad bearish narrative mentioned previously.
4 Hourly Chart
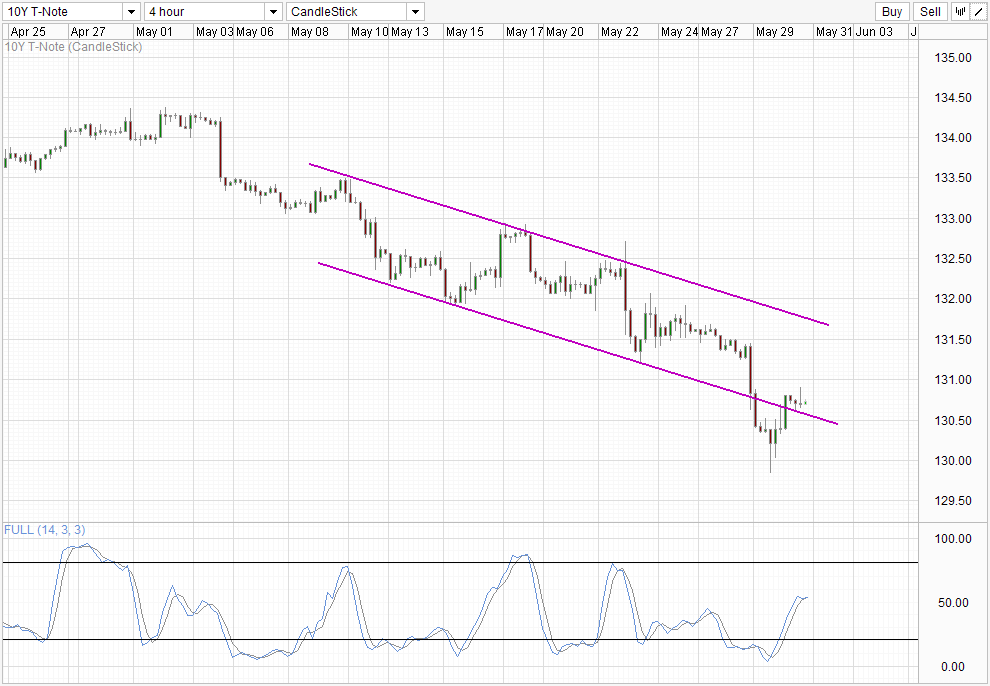
It is interesting to note that the bearish breakout in the short-term chart is also being reeled back in, and looks more bullish compared to the longer-term chart. However, stochastic readings have tapered down significantly and is no longer pointing higher. Traders should watch 130.5 closely as a short-term breakout in this case will help to enhance the case for a breakout on the longer-term chart.
More Links:
USD/JPY Technicals – 101 Holding on
USD/SGD Technicals – 1.27 Holding with USD weighing
Gold Technicals – Potential Bullish Breakout But Outlook Bearish
This article is for general information purposes only. It is not investment advice or a solution to buy or sell securities. Opinions are the authors; not necessarily that of OANDA Corporation or any of its affiliates, subsidiaries, officers or directors. Leveraged trading is high risk and not suitable for all. You could lose all of your deposited funds.

Mingze Wu
Latest posts by Mingze Wu (see all)
- European Bourses Not Enjoying Bullish Winds From US Stocks - 17 April 2014
- More Aggressive Stimulus Possible Despite Premier Li’s Denial - 17 April 2014
- China March FDI -1.5% Y/Y vs +2.05% expected. First decline in more than a year. - 16 April 2014