The Kiwi dollar was threatening to trade below 0.806, and usher in a potential bearish breakout yesterday. But the support level held true, and price broke away from the descending Channel, and moved towards 0.818, breaking the smaller consolidation zone’s ceiling of 0.811 in the process.
Hourly Chart
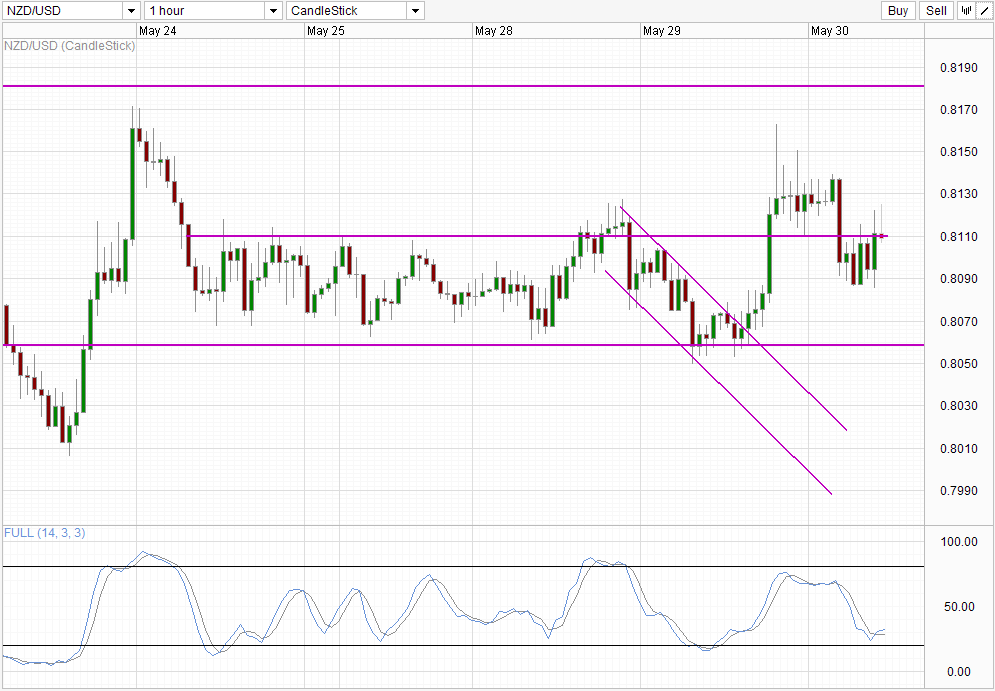
The sudden move that broke 0.811 can be attributed to the OECD economic outlook, which was released during the European trading hours, with the twice yearly report cutting global growth forecasts which resulted in a sharp move lower in US Stock futures which in turn pulled USD lower. NZD/USD hence rose, but ultimately failed to test the swing high back on 24th May. However, bulls would be glad to know that the breakout of the descending Channel occurred before the rally, suggesting that the strength of 0.806 is technically strong without needing any fundamental push in order to be valid.
Price did collapsed back under 0.8110 during early Asian hours after NZ Central Bank RBNZ said that it is prepared to increase currency sales to bring down a “significantly over-valued” NZD. Apparently a 500 pips ~ 6% decline since early May is not good enough. Perhaps Gov Wheeler wish to see NZD/USD going back below 80.0 or perhaps below the multi-year ascending trendline (see below) before he’s pleased. Wheeler is continuing to be heavily dovish, saying that RBNZ is “prepared to scale up our FX activities if we (RBNZ) see opportunities to have greater influence”. This sign of commitment pushed price lower slightly, but all in all the reaction is relatively muted due to the fact that Central Banks tended to be at the mercy of the rest of the global markets. We’ve seen RBA and BOJ failing in recent years to weaken their respective currency via outright selling of their currencies, and it remains to be seen whether RBNZ will have the financial clout to sustain a long-term weakening move without utilizing rate cuts, which is currently out of its reach due to the housing bubble.
Weekly Chart
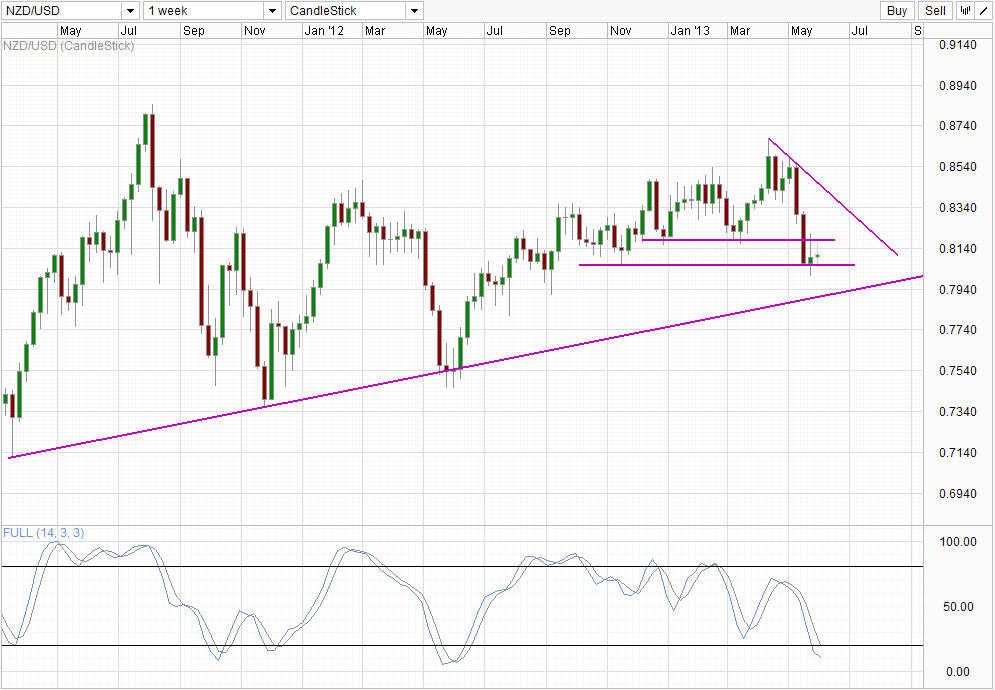
RBNZ reported that they have sold $256 million NZD in the month of April, which was generally a flat month of trading. This is a good evidence that the influence of secondary market activities is highly unlikely to influence longer-term trends. The primary reason why NZD/USD collapsed in recent weeks must still be attributed to the broad USD strengthening narrative, which will continue to be in focus in the next coming weeks at least.
More Links:
GBP/USD – Runs Into Resistance at 1.5150 Again
AUD/USD – Rallies Back Above the Key Level of 96 Cents
EUR/USD – Rallies Strongly to Back Above 1.29 Again
This article is for general information purposes only. It is not investment advice or a solution to buy or sell securities. Opinions are the authors; not necessarily that of OANDA Corporation or any of its affiliates, subsidiaries, officers or directors. Leveraged trading is high risk and not suitable for all. You could lose all of your deposited funds.

Mingze Wu
Latest posts by Mingze Wu (see all)
- European Bourses Not Enjoying Bullish Winds From US Stocks - 17 April 2014
- More Aggressive Stimulus Possible Despite Premier Li’s Denial - 17 April 2014
- China March FDI -1.5% Y/Y vs +2.05% expected. First decline in more than a year. - 16 April 2014