Daily Chart
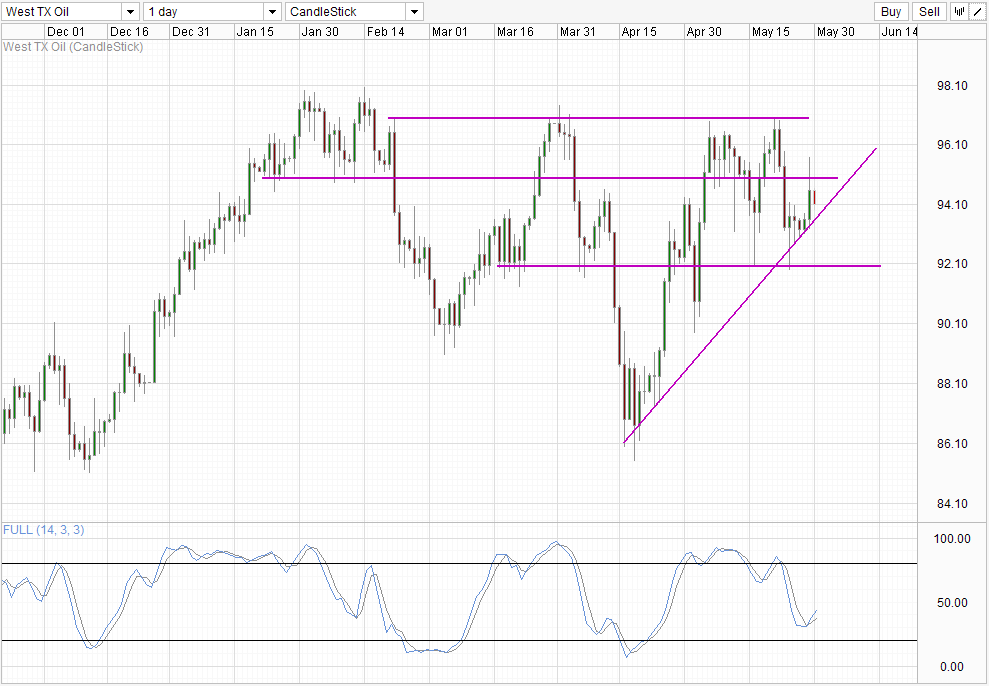
Is crude Oil in a up or downtrend?
If we look from a YTD perspective, current price is slightly above the 1st Jan level, and price is also much higher than the recent lows of around 86.0, suggesting that an uptrend is in play now. However if we take a look at the recent highs, it is clear that the peaks of 2013 has been getting lower and lower, with the 2 major troughs in 2013 one deeper than the other, which is a classic description of a downtrend. To delve deeper, if we look from the rally since Mid April, current pullback from 97.0 can be regarded as a minor pullback, which affirms the uptrend assertion (price is still trading above the rising trendline). Stochastic readings seems to suggest that is the case, as readings are currently pointing higher after a Stoch/Signal cross. But if we look from the perspective of the decline since May, yesterday’s failure to stay above 95.0 is a sign that bears are still strong, which is a point in favor of a bearish outlook. Even the stochastic readings that are currently pointing higher could easily head lower if price breaks the rising trendline, and approach 92.0 once again.
With all these conflicting signals, it is not difficult to simply say that price is trading sideways. And perhaps this view may be correct – price is mostly trading between 90 – 97 for most part of 2013, 92-97 is yet another smaller consolidation within the aforementioned consolidation zone. And looking at how erratic recent US DOE inventory data has been, it may not be that far out to consider current price to be of a sideways nature. In fact, a more liberal chart interpretation can regard the entire 86.0 – 98.0 as a sideways trend.
With OPEC meeting this Friday, there is a chance price may start to climb higher should OPEC adjust its production ceiling lower. As it is, participating countries of OPEC has been sticking extremely close to the output ceiling, signalling the best period of discipline since the current limit has been set. Despite such strict adherence, demand of Oil is expected to fall even further due to global economic slowdown, and that may prompt OPEC to shift its ceiling substantially to curb issues of oversupply. However whether this will result in a longer-term price positive push given that OPEC output is only 40% of global production. It is significant, but hardly a monopoly. WTI prices have been more closely linked to US supply which is still relatively abundant, and hence the impact of a lower production ceiling for OPEC countries, even after assuming that all participating countries will comply strictly is limited.
More Links:
EUR/USD Technicals – Approaching H&S Neckline
NZD/USD Technicals – 0.806/0.812 Consolidation Threatened
USD/SGD Technicals – Short-term Double Top or Temporary Pullback?
This article is for general information purposes only. It is not investment advice or a solution to buy or sell securities. Opinions are the authors; not necessarily that of OANDA Corporation or any of its affiliates, subsidiaries, officers or directors. Leveraged trading is high risk and not suitable for all. You could lose all of your deposited funds.

Mingze Wu
Latest posts by Mingze Wu (see all)
- European Bourses Not Enjoying Bullish Winds From US Stocks - 17 April 2014
- More Aggressive Stimulus Possible Despite Premier Li’s Denial - 17 April 2014
- China March FDI -1.5% Y/Y vs +2.05% expected. First decline in more than a year. - 16 April 2014