Unlike USD/JPY, Copper has indeed seen better days. Demand for copper has dropped considerably due to the fall in manufacturing activities across the globe in 2013. The outlook beyond 2013 is slightly better, but one of the largest consumer of Copper – China, is not expected to recover to its heydays within the next 2-3 years. Hence it is not surprising to see Copper trading much lower in 2013, shedding more than 50 cents YTD and around 80 cent from 2013 peak to trough.
Hourly Chart
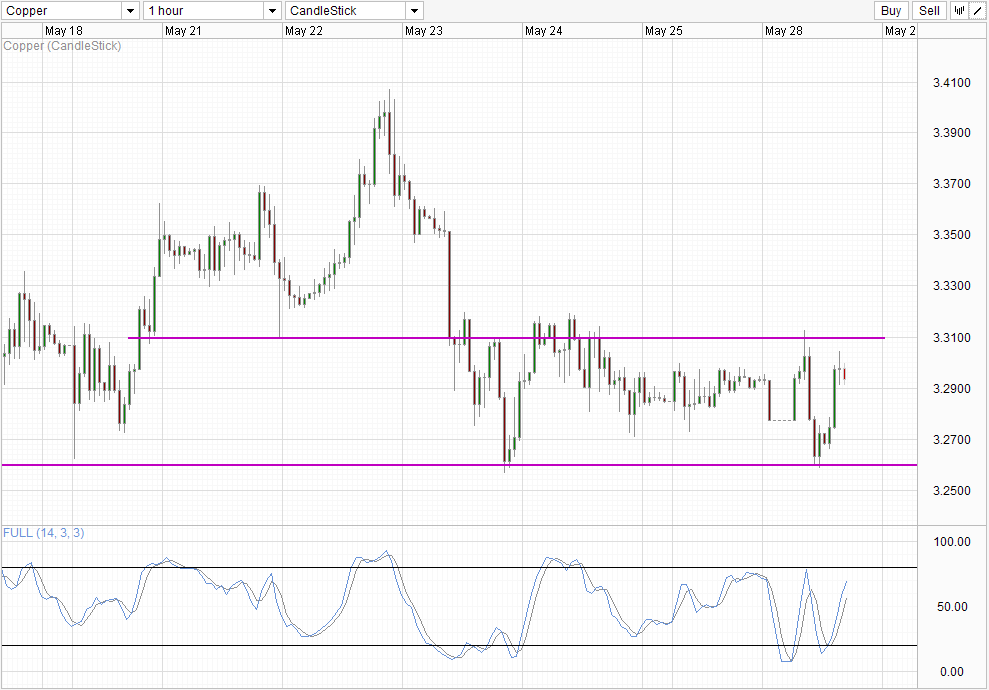
Short term chart shows copper trading between 3.26 and 3.31 since 23rd May. Volatility wasn’t high yesterday due to US bank holiday, but traders and speculators came back with a vengeance today with price touching the ceiling of the consolidation zone and immediately went for the bottom range. This serves to tell us 2 things – Consolidation zone is still holding out well, and that traders are also undecided on which direction copper may go in the short-term.
Weekly Chart
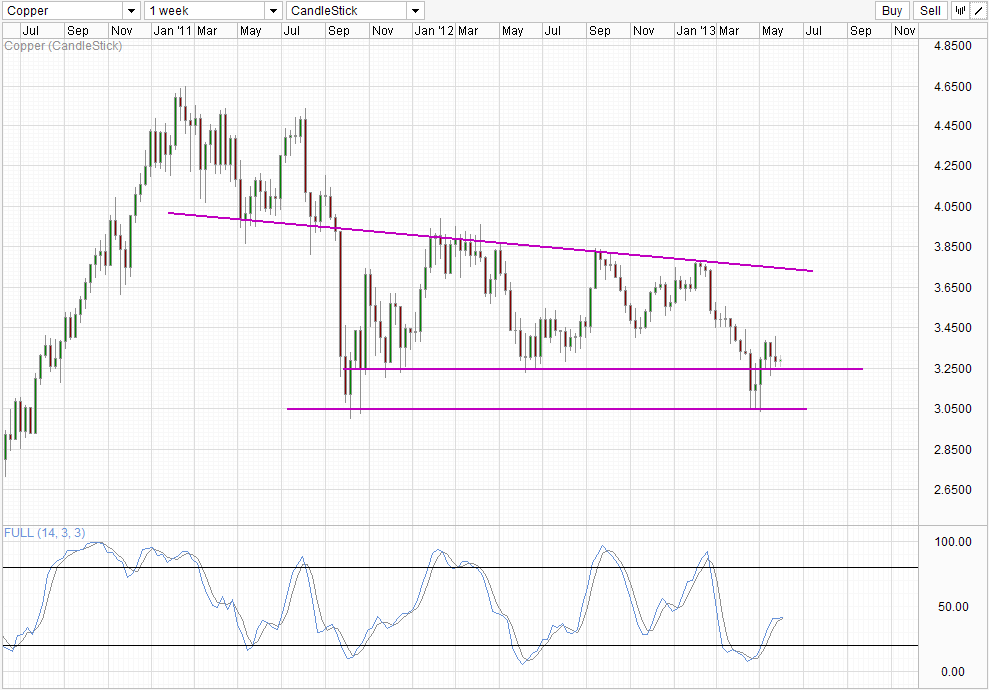
Why the indecision? Despite the fact that outlook for 2013 is not as rosy as we thought it may be back in 2012, we are certainly leaps and bounds ahead compared to the dark days of 2008. Furthermore, price has indeed recovered significantly since the early 2009 lows of sub 1.50 USD per lb of copper, and looking from a long-term historical perspective, price is indeed on an uptrend since 2004. To complicate matters, despite the weaker fundamentals, stocks are holding on to their gains convincingly after recent minor setbacks, and numerous consumer sentiment reports are showing broad optimism across the globe.
Given such conflicting information, it is understandable why copper traders may be confused and afraid to commit heavily into a singular direction. Generally, in times of uncertainty, support/resistance levels tend to hold better. If this statement holds, the fact that price is able to push above 3.26 and rebound from 3.05 opens up the top 3.85 as potential bullish targets. Price may still find resistance in the form of the descending trendline that has held significance since 2011.
Stochastic readings currently is marginally pointing lower, forming an interim peak just under 50.0. This suggest that a move towards 3.25 and 3.06 is possible, but as this is an interim peak, it will not be surprising to see price not breaking the support but instead bounce higher. Ultimately, even if price push up higher from here, it will still be within the consolidation range of 3.05 – 4.00, which still does not give us a good indication of whether price is long-term bullish/bearish. This may be good for swing traders, but perhaps long-term directional traders will have to be a little bit more patient as we wait for stronger fundamental cues in the future.
More Links:
USD/JPY Technicals – Bull Trend remains intact
Gold Technicals – Short term breakout potential
GBP/USD – Settles Around 1.51
This article is for general information purposes only. It is not investment advice or a solution to buy or sell securities. Opinions are the authors; not necessarily that of OANDA Corporation or any of its affiliates, subsidiaries, officers or directors. Leveraged trading is high risk and not suitable for all. You could lose all of your deposited funds.

Mingze Wu
Latest posts by Mingze Wu (see all)
- European Bourses Not Enjoying Bullish Winds From US Stocks - 17 April 2014
- More Aggressive Stimulus Possible Despite Premier Li’s Denial - 17 April 2014
- China March FDI -1.5% Y/Y vs +2.05% expected. First decline in more than a year. - 16 April 2014