The Reserve Bank of New Zealand released its Q2 inflation forecast earlier today, surprising traders with the lowest forecast since Q4 1999. Inflation for next Quarter is expected to be 2.06%, vs the 2.2% forecast for Q1, which will give RBNZ wider scope to slash rates/stimulate market if they wish to do so. This should mean lower NZD/USD, but price did not move lower, but instead trade much higher following the news.
So what gives?
2 possibilities –
1) The market may be placing more weight on the fact that wider scope for RBNZ action would be long-term positive for NZ economy, and subsequently a stronger NZD. Given that price has been trading 600 pips lower from April’s high, it stands to reason that a rate cut scenario would have already been priced in, which gives way to potential stronger fundamentals in the future which pulls NZD higher.
2) The market has been overly bearish and overaggressive in its discount of NZD for a rate cut scenario. So much so that they were expecting a much lower RBNZ inflation expectation. A read of 2.06%, though representing a recent year low, is still rather healthy and within the 2-3% inflation target. As such, it is unlikely that RBNZ will actually carry out a rate cut as they do not foresee next quarter to be much worse than before.
Explanation 2 seems more likely, but either way, price is moving up, and what we need to know is whether this rally has legs to run.
Weekly Chart
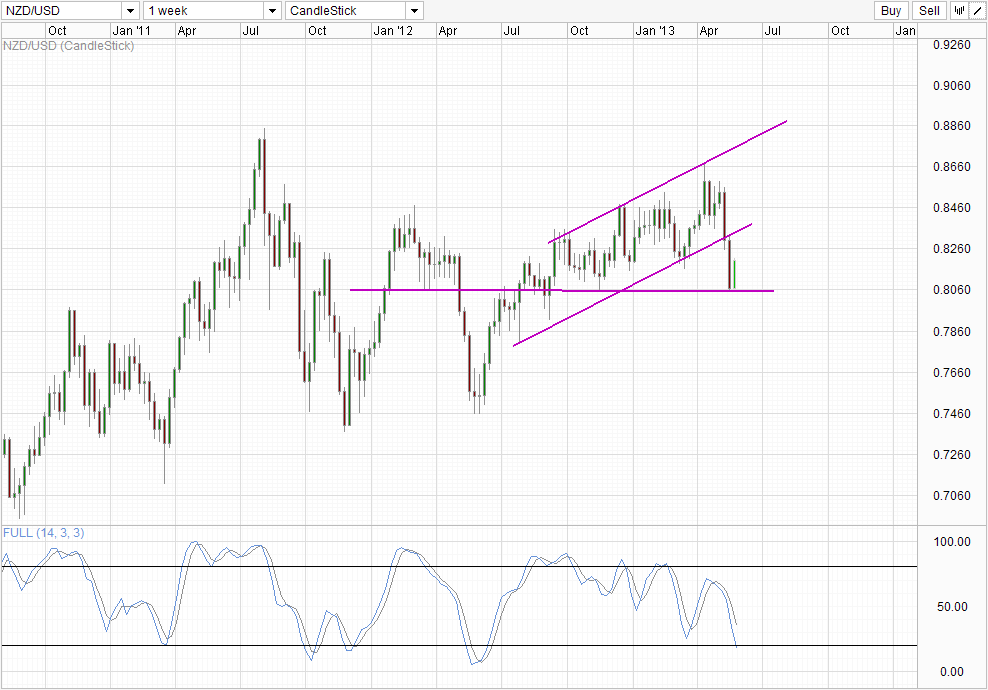
Traders are asking the same question from a technical perspective. Price has broken below the rising Channel, but was stopped by 0.806 significant support. Current week’s rally is seeking to re-test the Channel once more, with a break potentially invalidating current bearish breakout and returns the bullish trend since Jun 2012 into play. Stochastic is also showing mixed signals – with readings entering into the Oversold region suggesting that a bull cycle may be under way, yet there is also a divergence seen between price tops and stochastic peaks. As such, more clarification from price action is certainly needed, and traders should continue to wait for further confirmation to ascertain direction for the next half of 2013.
Hourly Chart
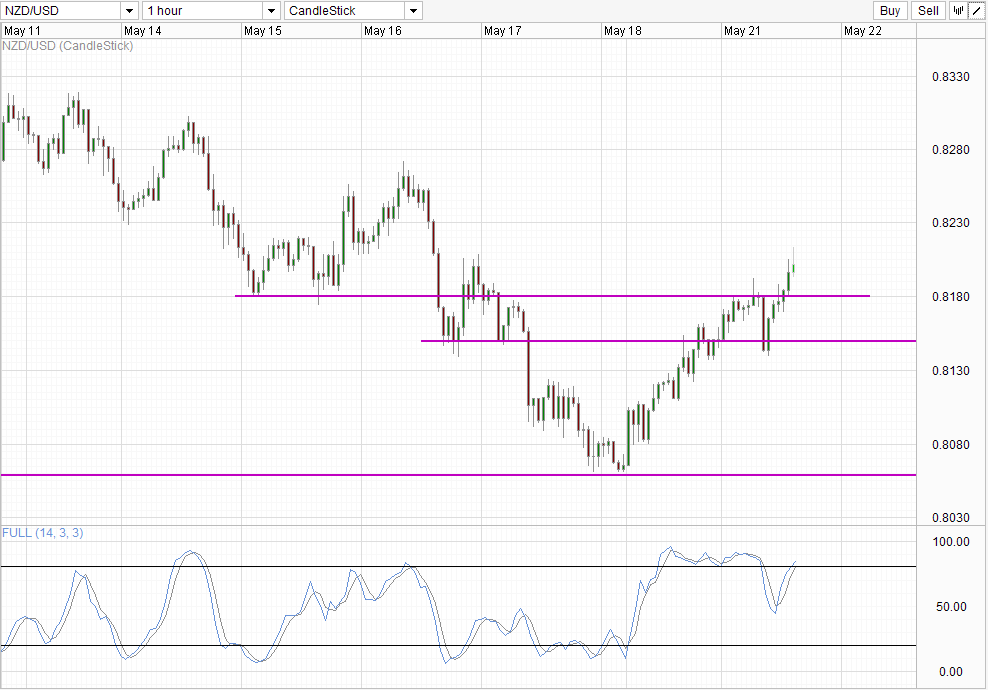
Hourly Chart show prices breaking short-term support turned resistances with seeming ease, and show us that the rally actually started yesterday, before the inflation forecast was released. This lend credence to the idea that market could have over extended itself on the bearish front, which is in-line with scenario 2 discussed above. However, price is certainly not out of the woods yet, with more resistances yet to come. Stochastic readings are already within Overbought regions, and could easily pull back to signal a bear cycle at any of the resistances above. In order for true bullishness to take hold, price will need to clear 0.83 and move above 0.833, which is similar to the levels close to the rising Channel from Daily Chart.
More Links:
AUD/USD – RBA Meeting Minutes Suggest Narrower Scope For Cut
EUR/USD – Meets Resistance at 1.29
GBP/USD – Edges Up as Markets Eye UK Inflation Figures
This article is for general information purposes only. It is not investment advice or a solution to buy or sell securities. Opinions are the authors; not necessarily that of OANDA Corporation or any of its affiliates, subsidiaries, officers or directors. Leveraged trading is high risk and not suitable for all. You could lose all of your deposited funds.

Mingze Wu
Latest posts by Mingze Wu (see all)
- European Bourses Not Enjoying Bullish Winds From US Stocks - 17 April 2014
- More Aggressive Stimulus Possible Despite Premier Li’s Denial - 17 April 2014
- China March FDI -1.5% Y/Y vs +2.05% expected. First decline in more than a year. - 16 April 2014