USD took a slight down turn yesterday due to the slight losses incurred on S&P 500 and Dow Jones Industrials. This dip in USD strength went a long way for commodities though, with Gold rallying from 1,350s to 1,390s, almost touching 1,400 in the process. On the other hand, Crude Oil also enjoyed a strong run, bouncing from a 95.0 low to a 97.0 high yesterday.
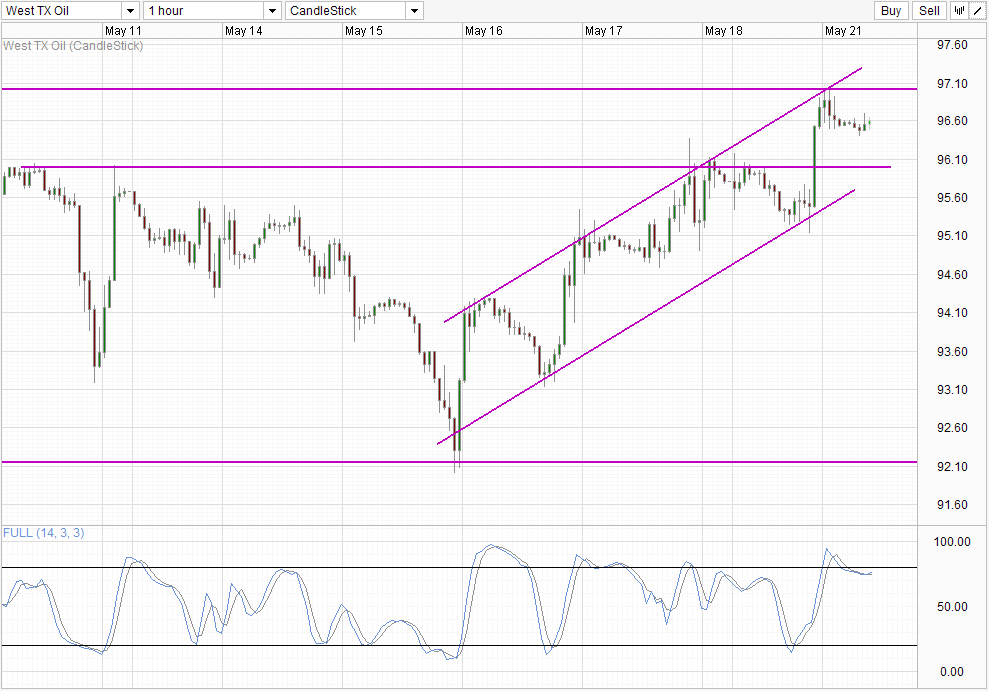
Hourly Chart
This rally is strange considering the heavy weakness in demand forecast issued by the International Energy Agency, and they are not the only one thinking demand will fall. OPEC was reported having an emergency meeting earlier this month to discuss the declining demand and increasing supply that is coming out of the closely knitted region, while the American Petroleum Institute and Department of Energy both agree that US’s output will continue to increase, giving WTI Crude a dismal outlook. In fact, overall sentiment on Oil has been extremely bearish, which resulted in Crude prices trading below 85.0 USD per barrel just a month ago while global stocks are pushing for record, if not higher highs.
However, recent trends suggest that traders are getting less concerned with the demand/supply issues, with price trading back into Jan ranges, where traders were actually optimistic about WTI Crude due to newer pipelines being opened in Cushing Oklahoma which will allow refineries to take in more inventory within US instead of relying on Brent imports. The premium between Brent and WTI has narrowed significantly in 2013 largely due to this, but overall it is hard to imagine that this reason alone will be able to lift WTI above current levels especially with global demand concerns unresolved.
From a technical perspective, price is facing a resistance around 97.0 round number which is also the confluence with the rising Channel Top. This opens up a potential move towards Channel Bottom, and allow for a re-test of 97.0 especially since Channel Bottom has cleared the 96.0 resistance level. Stochastic readings are flattening out despite forming a bear cycle signal towards the end of yesterday US trading session. If the interim trough pattern takes hold, we could see a move towards Channel Bottom cut short, with a retest of 97.0 coming faster than expected.
Daily Chart
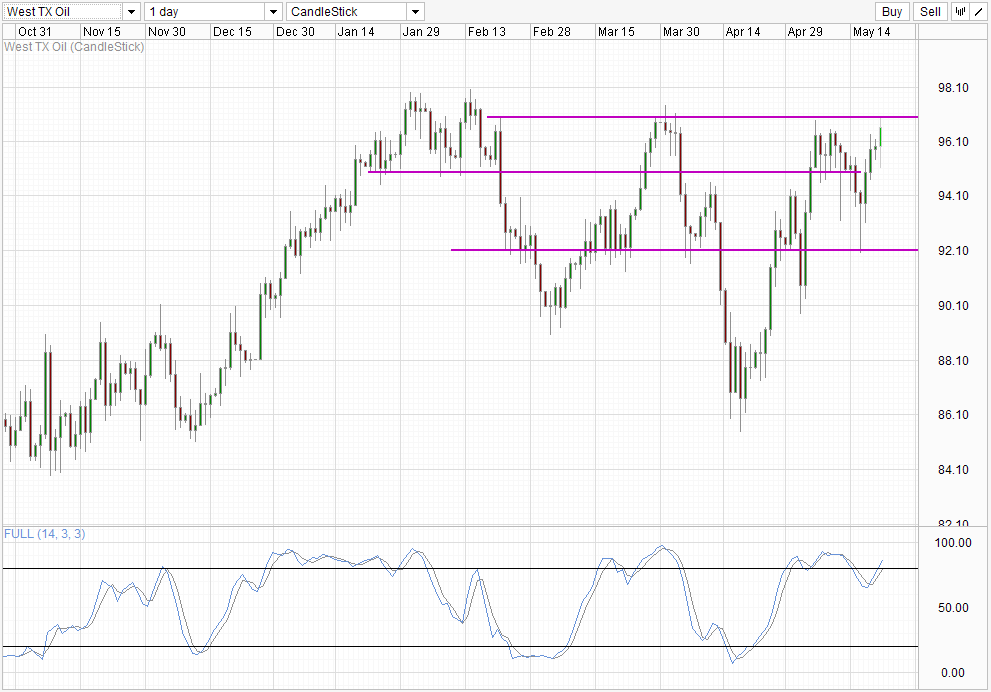
Daily Chart is highly interesting. Despite the fact that the rally from April Lows is still intact, price is technically posting lower highs and lower lows since Jan 2013. This lack of clear bias echos the views from fundamentals – looking weak yet sentiment is strong. If price is able to clear 97.0 and preferably 98.0 convincingly, we could be seeing a stronger bullish push higher as any lingering hopes of bearish reversal would be gone, giving bulls free reign to move towards the 100.0 big figure. However, should price fail at 97.0 again, do not be surprise to see quickened selling back towards 92.0 similar to what we’ve seen during early May due to the potential bearish setup mentioned earlier.
More Links:
USD/CAD – Strong US Dollar Continues to Test 1.03 Level
AUD/USD – Posts Gains as Markets Wait for Release of RBA Minutes
GBP/USD – Edges Up as Markets Eye UK Inflation Figures
This article is for general information purposes only. It is not investment advice or a solution to buy or sell securities. Opinions are the authors; not necessarily that of OANDA Corporation or any of its affiliates, subsidiaries, officers or directors. Leveraged trading is high risk and not suitable for all. You could lose all of your deposited funds.

Mingze Wu
Latest posts by Mingze Wu (see all)
- European Bourses Not Enjoying Bullish Winds From US Stocks - 17 April 2014
- More Aggressive Stimulus Possible Despite Premier Li’s Denial - 17 April 2014
- China March FDI -1.5% Y/Y vs +2.05% expected. First decline in more than a year. - 16 April 2014