AUD/USD has been extremely bearish in May following RBA’s surprise rate cut. The rise of USD strength worsen matters as the already bearish Aussie got pushed down quickly, falling from a 1.058 high from mid April to below parity this week. On the last day of trade this week, China twisted the knife into the Aussie, with the Yuan Official Central Parity Rates fixed by PBOC coming in at 6.0858 vs yesterday’s 6.1431 – close to a 1% drop. This is a larger fall compared to AUD/USD 0.8% fall during the same timeframe. AUD/USD responded to the PBOC’s more pessimistic outlook by filling in the 0.2% blank, sending AUD/USD below 0.98.
Astute traders would notice that the fall of about 50 pips following the news is definitely larger than the 0.2% in pricing difference – around 20 pips would have sufficed. However this is not surprising that under such bearish pressure, such negative signal from China would trigger overreaction on the downside.
Hourly Chart
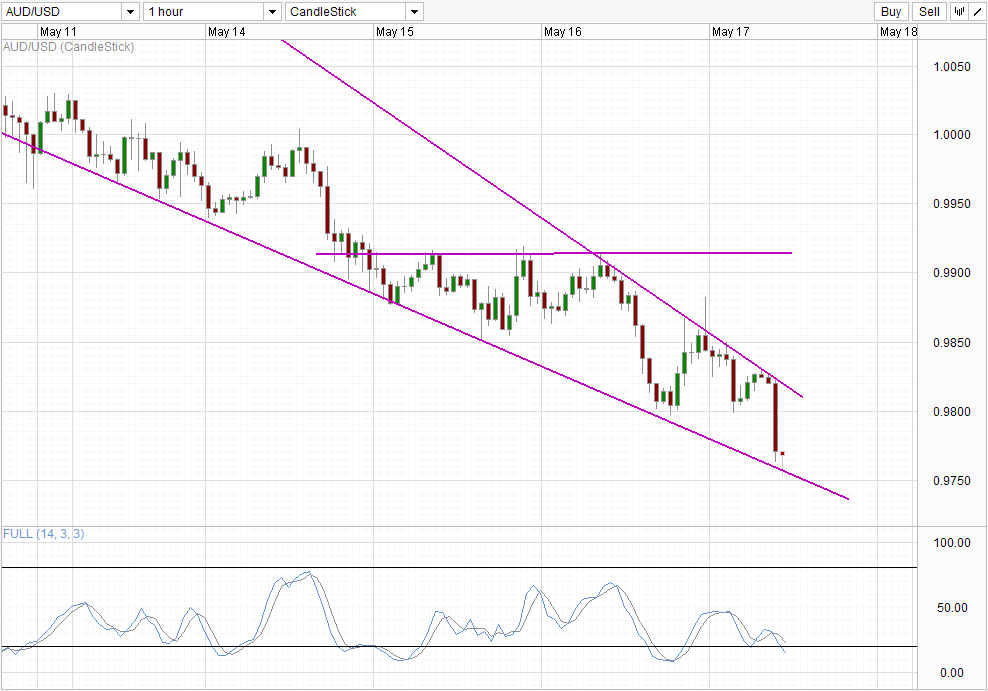
From a technical perspective, a break of 0.98 brings short-term bearish pressure back in the fold. Price was bouncing off 0.98 earlier today and there was a possibility of price re-testing 0.985 should price remained where it was as the downward trendline would have been broken, bringing fresh bullish impetus towards 0.985. Stochastic readings were also pointing higher until shortly before the sell-off, which suggest that a bull cycle would have been in the cards, which has now been thrown entirely out of the window thanks to PBOC.
Stoch readings has since reversed and is entering the Oversold region once more. Price may still be able to trade lower a fair bit more with reading levels still some distance away from the recent troughs, but with support available in the form of the lower descending trendline, a continued bearish acceleration may be slightly more difficult as opposed to a measured drop.
Daily Chart
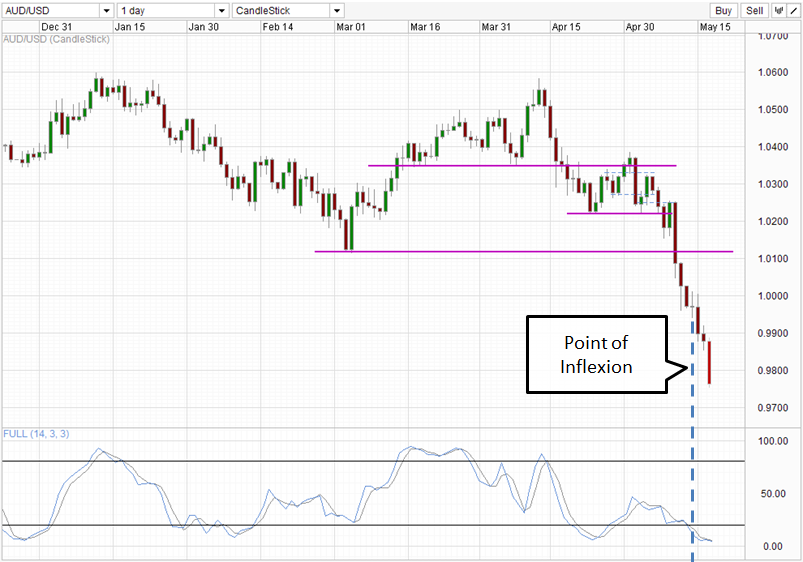
From the Daily Chart perspective, we’re looking at an extension of bearish trend following the reaffirmation of the bearish breakout of 1.012 with the point of inflexion being confirmed. The question now is how long this extended bearish extension can last? Current series of 3 black crows is similar to the past series of 3 black crows that pushed price below 1.012 – around 300 pips each. With Stochastic readings appearing to flatten out, a bullish correction may be seen rather soon. However the next significant level of support is around 0.96, therefore do not expect price to pullback significantly anytime soon. That is not saying it is impossible for bullish reversals to happen, but extraordinary scenario such as that will require extraordinary evidence. Avoid buying just because you think bulls are due a comeback after 7 consecutive bearish candles, look for confirmations that bulls are in charge instead.
More Links:
USD/SGD – Decline in Exports Driving SGD Weaker
EUR/USD – Finds Some Support at 1.2850
GBP/USD – Moves Well Off Support at 1.52
This article is for general information purposes only. It is not investment advice or a solution to buy or sell securities. Opinions are the authors; not necessarily that of OANDA Corporation or any of its affiliates, subsidiaries, officers or directors. Leveraged trading is high risk and not suitable for all. You could lose all of your deposited funds.

Mingze Wu
Latest posts by Mingze Wu (see all)
- European Bourses Not Enjoying Bullish Winds From US Stocks - 17 April 2014
- More Aggressive Stimulus Possible Despite Premier Li’s Denial - 17 April 2014
- China March FDI -1.5% Y/Y vs +2.05% expected. First decline in more than a year. - 16 April 2014