The Bearish Pennant described yesterday is broken following today’s selling which extended this week’s loss. However, the key takeaway from today’s action is not really on the Pennant, as the pennant reliability was always in suspect considering that we only have 2 reliable touch points based on 4 candles, including this week. The more important part appears to be the fact that price is now trading below last week’s low, and is currently seeking the closing price 4 weeks ago around 1,400 as a bearish target. If price clear below the level, the bullish pullback to 1,485 2 weeks ago will be invalidated, giving bears free reign to test the recent low of 1,320
Weekly Chart
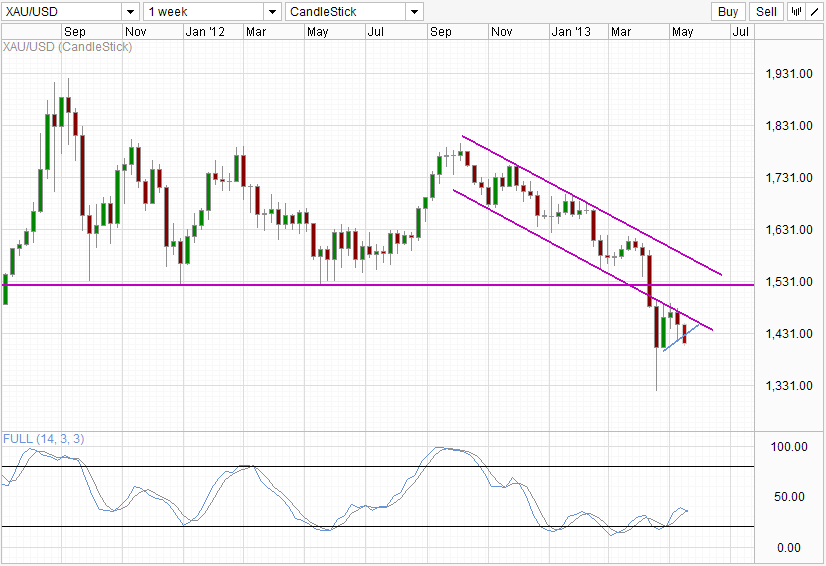
Following today’s selling, Stoch readings have closed (just barely) below the Signal line, suggesting that a bearish signal is in place. However, given current stoch levels, should price dip to 1,330 thereabouts too aggressively, a rebounding of price may be possible. In lieu of this, a more stable and slow decline similar to what we’ve seen back in Oct 2012 to March 2013 may be preferred in order to bring prices beyond 1,330.
Hourly Chart
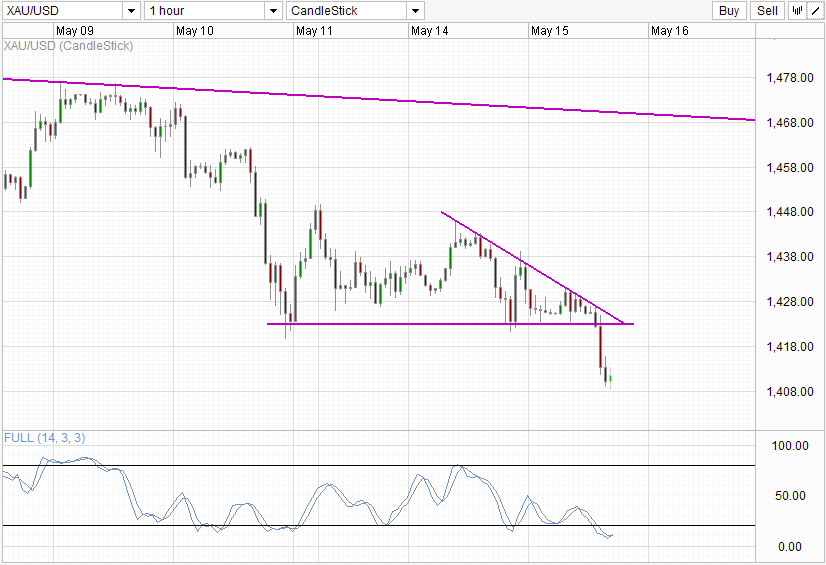
Hourly Chart shows its own breakout with 1,423 being broken. Stochastic readings is bottoming out after the move though, which suggest that price may pullback towards the support level again. Before that however, it is likely that price may find resistance in the form of current descending trendline first, which may result in interim stoch peaks to be formed similar to what we’ve seen when Stoch readings hit between 35 to 50.
Strength of USD will continue to play a large part in Gold pricing moving forward, and that will depend largely on US stock’s ability to rise higher. With stock returns looking extremely healthy compared to precious metals, it is also likely that holders of gold may wish to liberate their positions to participate in US stocks right now. The exit of money from ETF gold products is a very clear sign of what has happened in recent months, and may continue to signal direction within next 1-2 months for both Stocks and Gold.
More Links:
WTI Crude – Breaking 94.0 support
USD/JPY Technicals – 102 new footing for Bulls
AUD/USD – Recovery above 0.99 thwarted by lower wages data
This article is for general information purposes only. It is not investment advice or a solution to buy or sell securities. Opinions are the authors; not necessarily that of OANDA Corporation or any of its affiliates, subsidiaries, officers or directors. Leveraged trading is high risk and not suitable for all. You could lose all of your deposited funds.

Mingze Wu
Latest posts by Mingze Wu (see all)
- European Bourses Not Enjoying Bullish Winds From US Stocks - 17 April 2014
- More Aggressive Stimulus Possible Despite Premier Li’s Denial - 17 April 2014
- China March FDI -1.5% Y/Y vs +2.05% expected. First decline in more than a year. - 16 April 2014