US Stock took a huge setback yesterday, with S&P 500 stock index gapping lower following Tuesday’s record high + close. Prices did not look back, consistently printing lower highs and lower lows throughout the day, ending the day 0.93% lower than Tuesday’s close. A huge part of the decline can be attributed to disappointing economic numbers both from US and China. Official Chinese PMI Manufacturing data came in at 50.6, indicating a slowdown of growth from previous month’s 50.9. Similarly, US ISM Manufacturing came in at 50.7, lower than the 51.0 estimate and also experiencing a similar slowdown from previous month’s 51.3. Payroll numbers did not look hot either, with ADP Employment numbers missing the mark by 31K, a huge gap by any standards.
However, one cannot ignore the possible impact of a technical pullback, as price has become highly extended since 1st Jan, when price was languishing around 1,400. There has not been any significant pullback 2,000 points later, and a significant sell-off may be due soon.
How soon? In line with “sell in May and go away” seasonal lingo, we’re starting to see current sentiment starting to shift to a bearish one. Yesterday’s surprisingly dovish FOMC Statement which hinted at possible additional QE failed to inspire any bullish comeback, with the immediate reaction failing to hit the bottom of 30th April consolidation, but instead resulted in much stronger bearish reaction after.
Hourly Chart
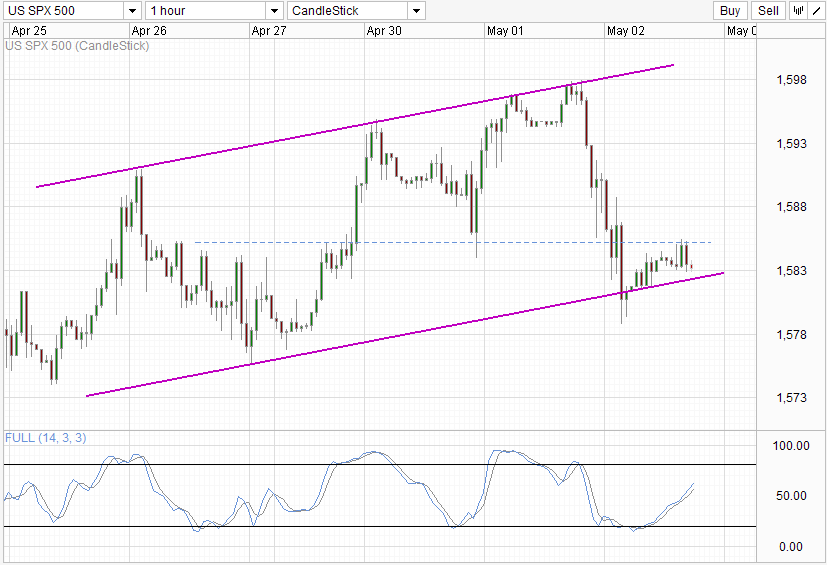
Price is currently kept afloat by Channel bottom. Stochastic suggest that we are in a corrective bullish cycle right now but interim resistance around 1,585 is preventing any further bullish headway. A retest of Channel bottom may be possible today, but the same could be said with regards to 1,585 as long as Stoch readings continue to point higher below the Overbought region.
Should price manage to break Channel bottom, we may find 1,575 – 1,578 thereabout providing support for a retest of Channel bottom once more. Should price is unable to break into the Channel, that may be the final nail in bulls’ coffin as a confirmation for bearish breakout out of current rising channel. A break above 1,585 will stall bearish pressure and allow Channel to be in play, which opens up Channel top as possible bullish objective.
Daily Chart
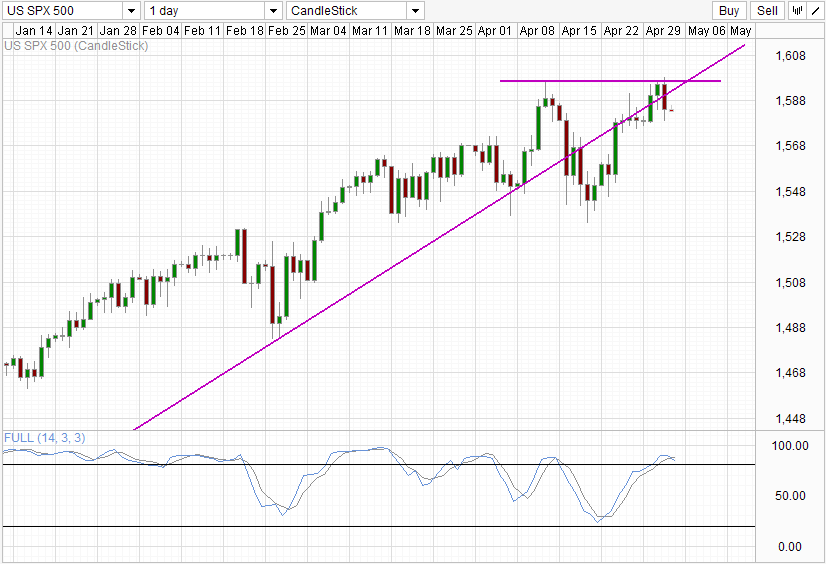
Daily Chart is much more bearish though, with price appearing to breakout of the rising trendline. However, price has broken away from the trendline once back in April with limited bearish follow-through, and there is a chance that similar pattern may occur this time round. Preferably, price should trade below 1,575 for a confirmation of this bearish break which may allow for a retest of April lows once again. Stochastic readings are in favor of a bearish scenario with a Stoch/Signal cross. Past bearish signals since Feb have generally been correct with mixed results, and we could expect S&P 500 to test 1,575 at the bare minimum if the signal is proven to be correct.
More Links:
Gold Technicals – Awaiting bearish rejection confirmation
EUR/JPY – Market Expect ECB Rate Cut, Breakout Potential
WTI Crude – All time high inventory levels pushing price down
This article is for general information purposes only. It is not investment advice or a solution to buy or sell securities. Opinions are the authors; not necessarily that of OANDA Corporation or any of its affiliates, subsidiaries, officers or directors. Leveraged trading is high risk and not suitable for all. You could lose all of your deposited funds.

Mingze Wu
Latest posts by Mingze Wu (see all)
- European Bourses Not Enjoying Bullish Winds From US Stocks - 17 April 2014
- More Aggressive Stimulus Possible Despite Premier Li’s Denial - 17 April 2014
- China March FDI -1.5% Y/Y vs +2.05% expected. First decline in more than a year. - 16 April 2014