After the bulls rejected bears advances below 0.848, bulls have seized the initiative to push prices back up towards 0.853 and subsequently broke the level convincingly, trading above the previous swing high of 25th April and finding support around 0.8545 – the structural ceiling on 25th April. The initial bearish pullback towards the end of the US trading session was further fueled by a surprisingly fall in New Zealand Building Permits, coming in at -9.1% M/M, the largest decline since Oct 2011 and much lower than the expected +2.0%. The ANZ Business Confidence Index which came in later during early Asian session did not help bulls any better, coming in weaker at 32.3 vs previous 34.6. Nonetheless, a print above 0.0 represent optimism by business managers, and perhaps did play a part to help bulls consolidate their strength around 0.8545.
Hourly Chart
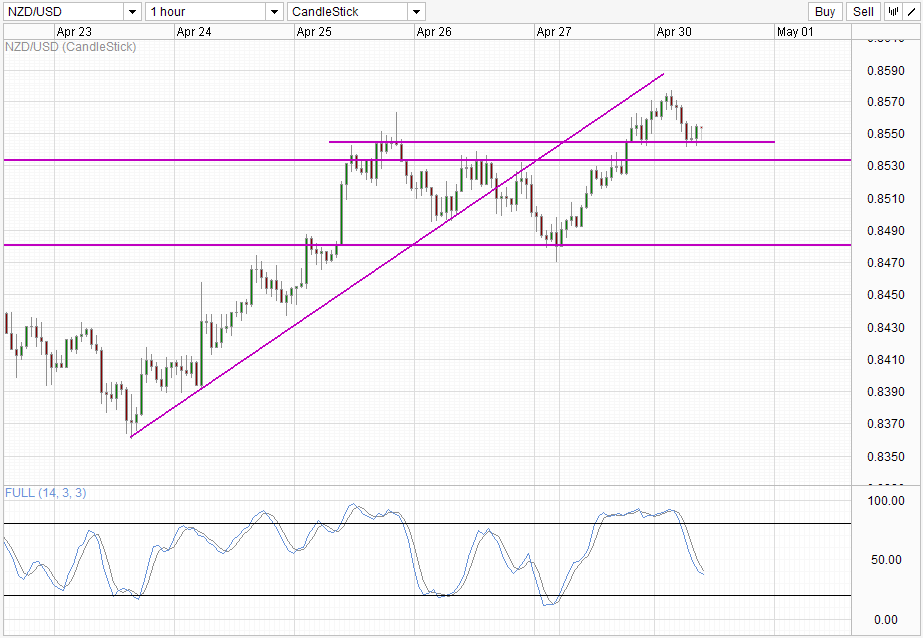
From a Technical perspective, price clearing 25th April’s high and structural ceiling is a strong statement of bullish intent, and allows bulls to use 0.8545 as a base camp to venture higher peaks. Stochastic readings are currently pointing lower, with Stoch and Signal line converging towards each other, suggesting that readings may form an interim trough soon. What this imply for price is that we could still see price dither around 0.8545 for a while more before bullish revival can take place once more.
Daily Chart
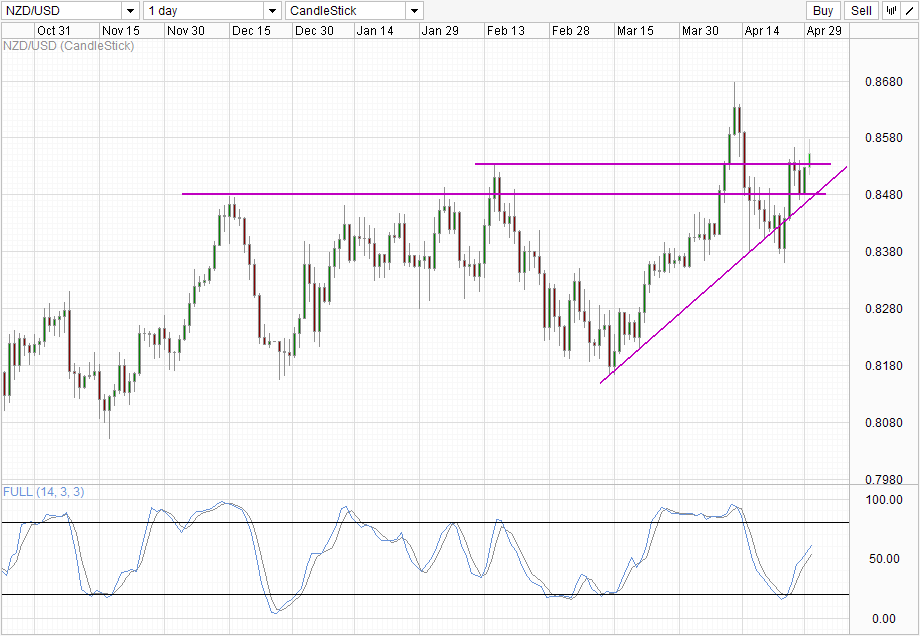
Daily Chart is certainly bullish now after the clearing of 0.853, invalidating the recent Evening Star candlestick pattern and reaffirming bull trend from 0.838 and also the rally from 0.818. This open the way for price to test 0.868 once more and also align current bias with the overall long-term trend since 2009 (not seen on chart). Stochastic readings remain bullish as readings continue to point higher with ample space for both readings and price to climb towards 0.868.
Fundamentally, the declining building approvals is a good thing for New Zealand economy in the long run as it implies that there are lesser construction activities for properties – a sure sign that demand for homes are dropping and a deflationary relief for home prices. However, the long term impact on NZD/USD remains up in the air. If the housing bubble is resolved within 2013, the likelihood of RBNZ raising rates would decrease as China and Europe are unlikely to have resolved their growth issues by then (despite what ECB’s Draghi and IMF say, they’ve gotten it wrong about Greece and Spain time and time again). But we also cannot ignore the fact that long-term housing bubble remain a bearish NZD/USD risk especially if it explodes in everybody faces. Given that RBNZ is unlikely to shift rates in 2013 (because they say so, but they could lie), it will be interesting to hear their interpretation of current data and gauge whether we’ll see a hawkish or dovish RBNZ in 2014.
More Links:
AUD/USD – Moves Back to Key Level of 1.0360
EUR/USD – Moves Up to Resistance at 1.31
GBP/USD – After Ten Week High, Eases Back Under 1.55
This article is for general information purposes only. It is not investment advice or a solution to buy or sell securities. Opinions are the authors; not necessarily that of OANDA Corporation or any of its affiliates, subsidiaries, officers or directors. Leveraged trading is high risk and not suitable for all. You could lose all of your deposited funds.

Mingze Wu
Latest posts by Mingze Wu (see all)
- European Bourses Not Enjoying Bullish Winds From US Stocks - 17 April 2014
- More Aggressive Stimulus Possible Despite Premier Li’s Denial - 17 April 2014
- China March FDI -1.5% Y/Y vs +2.05% expected. First decline in more than a year. - 16 April 2014