Latest stock take from US Department of Energy showed that Crude Oil inventories fell by 1.2 million barrels, way below estimates that anticipated a gain of 1.2 million barrels instead. This would usually mean higher Oil prices as lower inventories is the end result of lower supply , higher demand, or a combination of both. However, price did not rally significantly, but instead the slide continued, with price managing to hit a new 2013 low during early Asian session.
Perhaps market is looking at the inventories further down the chain. Cushing OK crude inventories increased by more than 1 million barrels, while Distillate Inventories rose by 2.3 million barrels when estimates called for a decrease of 0.35 million barrels. Gasoline inventories have declined by 0.6 million barrels, but that is still less than forecast of -0.8 million barrels. This will almost certainly result in lower demand of crude moving forward if producers of the aforementioned refined products are not able to clear their stock. As such, it is understandable that current decrease in Crude is brushed away so easily as market expect inventories to stack up once more.
IMF came out yesterday delivering yet another blow to commodities with its downgrade of Euro-zone growth outlook in 2013-2014, adding on to a slew of bad news (Chinese GDP, continued decline of Japan Industrial Production, falling US Industrial Production) this week. Demand of Crude oil is certainly week and there appears to be no end in sight for current decline.
Hourly Chart
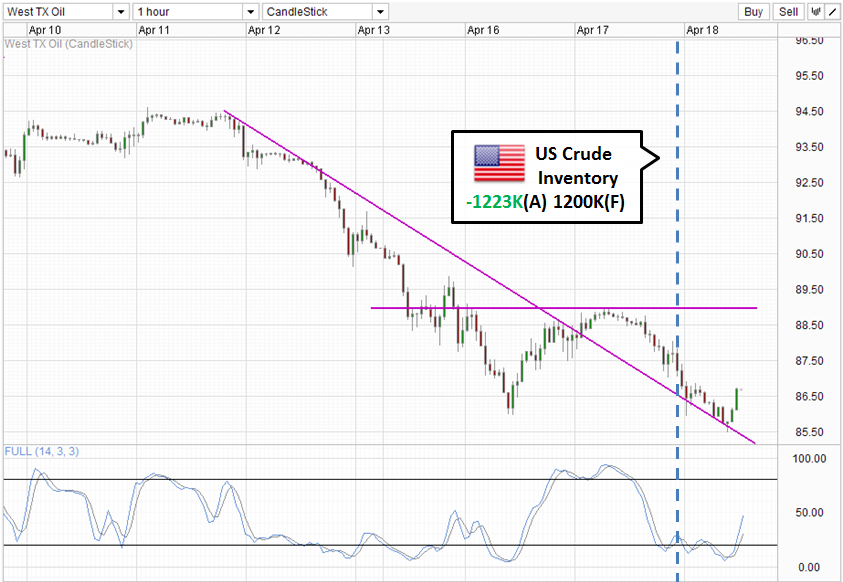
From a technical perspective, the recovery from 16th April low to 89.0 ceiling appears to be invalidated with a new low being formed. Current move higher seems corrective, but a move towards 87.5 interim support turned resistance should not be ignored. With Stochastic readings still pointing higher, there is no evidence that current corrective rally is stalling. However, readings may be able to form interim peaks just around 50.0 as it is prone to do in the past, and that may be in-line with a continuation of bearish activity as price has yet to push out of 86.7 short-term ceiling.
Daily Chart
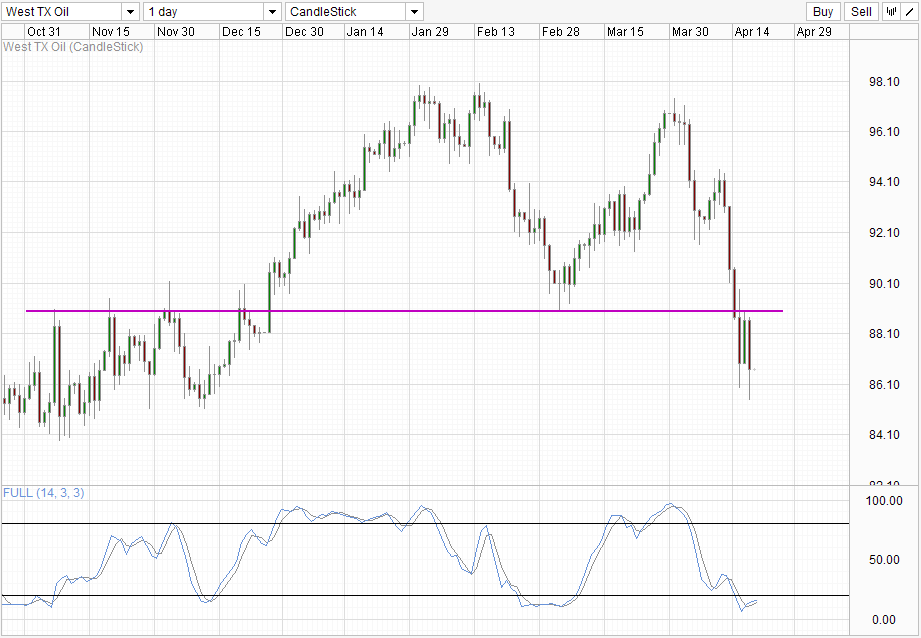
Daily Chart shows the confirmation of a bearish breakout below 89.0. Price has broken out 2 periods before, but the confirmation came only with the failure of yesterday’s candle to close above the support/resistance. As long as price trades below 89.0, the Eve-Adam double top will remain valid, making a push towards 84.0 possible. Whether price will be able to stay sideways at 84.0 (aka forming a handle) or continue south/rebound higher depends heavily on the demand/supply outlook when we reach there (if we ever do that is). Given dismal fundamentals that is unlikely to reverse itself soon, coupled with stock prices finally coming down from recent highs, a rebound scenario is unlikely. That being said, should the Fed suddenly surprise with an expansion of current QE initiatives, we could easily see risk-correlated assets such as Oil moving up quickly.
More Links:
NZD/USD – Rebound higher on Higher Consumer Confidence
GBP/USD – Falls Sharply and Settles Just Below Key Level of 1.5250
AUD/USD – Falls to Five Week Low under 1.03
This article is for general information purposes only. It is not investment advice or a solution to buy or sell securities. Opinions are the authors; not necessarily that of OANDA Corporation or any of its affiliates, subsidiaries, officers or directors. Leveraged trading is high risk and not suitable for all. You could lose all of your deposited funds.

Mingze Wu
Latest posts by Mingze Wu (see all)
- European Bourses Not Enjoying Bullish Winds From US Stocks - 17 April 2014
- More Aggressive Stimulus Possible Despite Premier Li’s Denial - 17 April 2014
- China March FDI -1.5% Y/Y vs +2.05% expected. First decline in more than a year. - 16 April 2014