West Texas Crude has recovered significantly from last week’s sell-off sparked by excessive backlog of supplies. Prices traded higher in steps – with big advances followed by smaller pullbacks. This rally was further aided by the same DOE Crude Inventory numbers that sent it to the pits recently. Crude Oil Inventories on 5th April reflected an additional 250K barrels, more than 1 million barrels lower than expected. Crude oil rallied a little, but the reaction is a dwarf compared to the enormous slide last week.
This would appear strange prima facie if we consider that the underlying bias is bullish, and we have the ascending Channel as evidence of the underlying sentiment. However, if we were to treat past 3-4 days movement as a mere technical rebound, then the overall bias remains bearish, and muted response towards bullish news during bearish bias is to be expected. Another alternate view is that the data released by Department of Energy was not entirely bullish. Despite lower than expected Crude Oil inventories, Cushing OK Crude Inventory actually rose. Distillate and Gasoline Inventories are also much higher than expected. This would mean that demand for Crude in the near future have very little possibility of growth, with downside aplenty when we factor in seasonality. This resulted in Crude Oil barely recovering back to 4th April consolidation on a day which S&P 500 closed at historical high.
Hourly Chart
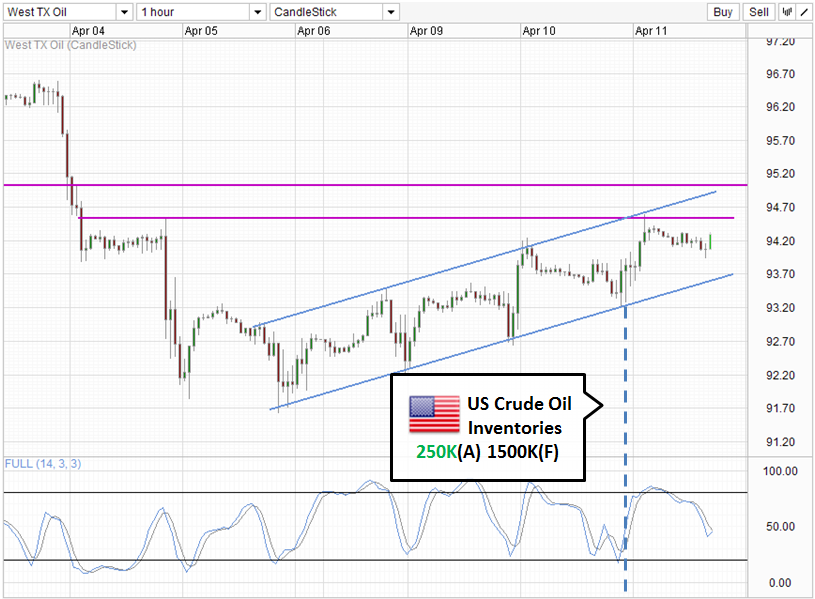
From a technical point of view, price may still be able to rally higher from here, however resistances lie await beyond the 94.3 consolidation ceiling. 1st barrier would be the swing high of 4th April, with the next level at 95.0 round number (visible via daily chart below). In between the 2 levels we have the Channel Top which has successfully rejected bullish breakout 3 times prior. Stochastic curve is currently in a bear cycle, however readings are pointing higher following the latest rally higher. This suggest that price could be forming an interim trough, though it is likely readings may enter into Overbought just when prices reach the aforementioned resistance levels.
Daily Chart
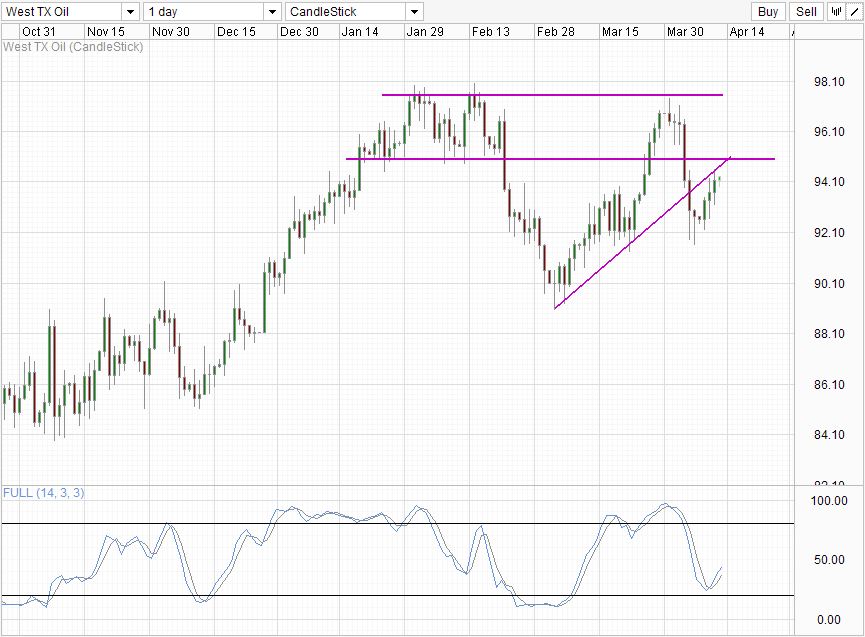
Direction from the daily chart is mixed, with uptrend from Q4 2012 still not yet invalidated, though the inability for March high to break higher is sending bearish signal about the sustainability of this uptrend. Current price can be interpreted as a pullback from earlier bearish breakout below the rising trendline. If this interpretation holds, price may be likely to find stronger resistance around 95.0, bouncing lower eventually to confirm the bearish breakout. Bearish acceleration towards 90.0 may happen with a break below the 92.0 round number, with a break of 90 opening the the 84-88 consolidation region as possible downside objective. However, Stochastic readings suggest that price may still be able to break 95.0 into the 95 – 98 trading zone. If that happens, bulls will be watching 98.0 keenly for a break higher to continue the bull run back in Q4 ’12.
More Links:
NZD/USD – Weaker Manufacturing Growth Spotted
GBP/USD – Continues to Pressure the Resistance Level at 1.5350
AUD/USD – More people losing jobs than expected
This article is for general information purposes only. It is not investment advice or a solution to buy or sell securities. Opinions are the authors; not necessarily that of OANDA Corporation or any of its affiliates, subsidiaries, officers or directors. Leveraged trading is high risk and not suitable for all. You could lose all of your deposited funds.

Mingze Wu
Latest posts by Mingze Wu (see all)
- European Bourses Not Enjoying Bullish Winds From US Stocks - 17 April 2014
- More Aggressive Stimulus Possible Despite Premier Li’s Denial - 17 April 2014
- China March FDI -1.5% Y/Y vs +2.05% expected. First decline in more than a year. - 16 April 2014