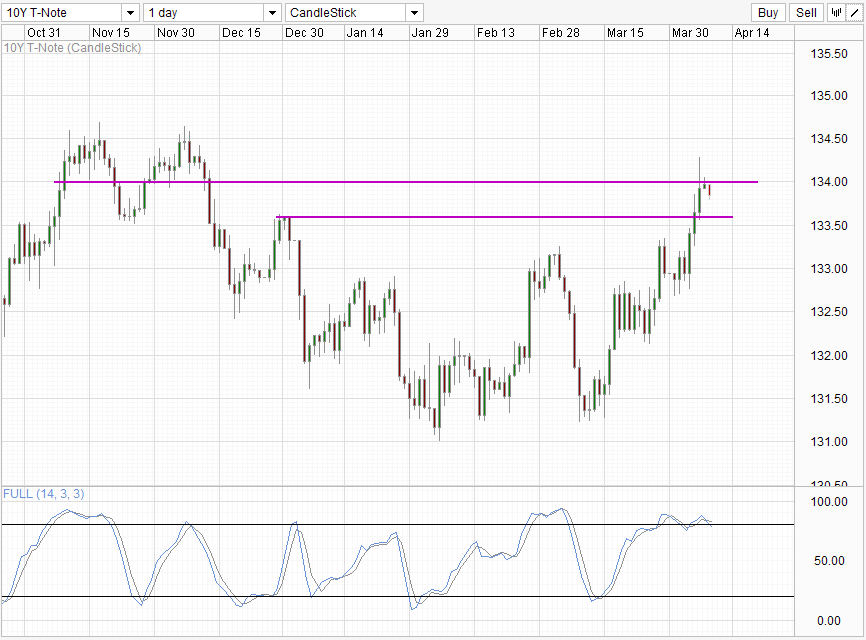
So much for the feel good factor during Q1 2013. After the partial resolution of US Fiscal Cliff, the Benchmark 10Y bond prices went lower sharply, trading around 131.50 at the end of January. Prices climbed higher once more leading to the 1st Mar Sequester dateline, but faced resistance around 133.0 and traded sharply lower once more, testing 131.50 after FOMC appeared to be increasingly hawkish, with Fed watchers speculating that QE3 may end soon. Since then, Ben Bernanke has spoken to the Senate and House on separate occasions, and reaffirmed Fed’s commitment to QE. This, coupled with worsening economic data from US, sent demand for treasuries soaring once more. Price has now hit 134.0 in recent days after testing 1st Jan highs for the first time, and breaking it at the first time asking.
Daily Chart
What does this mean? Does this increase in Bond demand means that the market is seeking safer havens? Well, not really. The Dow Industrials remain lifted above the 2007 record high, while S&P 500 isn’t far behind from its own historical landmark. “Fear Factor” Vix is marginally higher, but remains around the same levels back in Jan. Certainly the market does not appear to be spook, with both DJI and S&P 500 trading higher and filling in the bearish gap post dismal NFP data last Friday. So what is driving Bond prices higher?
It seems that the main culprit remains QE3. Worsening economic data in US only serve to entrench the belief that Fed will be forced to keep QE3 longer. It seems that market is addicted to stimulus and looks at negative data fondly. This is akin to the Russian saying: Shoot yourself in the foot now, to get the shoulder fixed at the hospital. While we’re not here to discuss the healthcare system of Russia, we can certainly see the danger of such sentiment. Eventually the Fed has to pull the plug on QE3, whether they like it or not. On the other hand, if the economy continue to languish despite the QE injection, this rot will certainly catch up on the market no matter how much QE we have. Either way you cut it, demand for safe assets such as Bonds seems certain to increase if everything remains the same.
This would go in-line from a technical point of view, as clearing 1st Jan’s high is definitely psychologically significant. Nonetheless, price will need to break above 134.50 convincingly to usher in a fresh new bullish impetus. Without which, bond sellers may be unlikely to square off their losing positions, allowing overall bias to remain to the downside. As it is right now, 134.0 is proving to be a strong adversary for bulls, with stochastic readings pointing lower suggesting that we may not see a break of 134.0 anytime soon. However, as long as price trade above Feb and Jan highs, bulls will continue to stay bullish just as how bears will stick with their convictions below 134.50
Hourly Chart
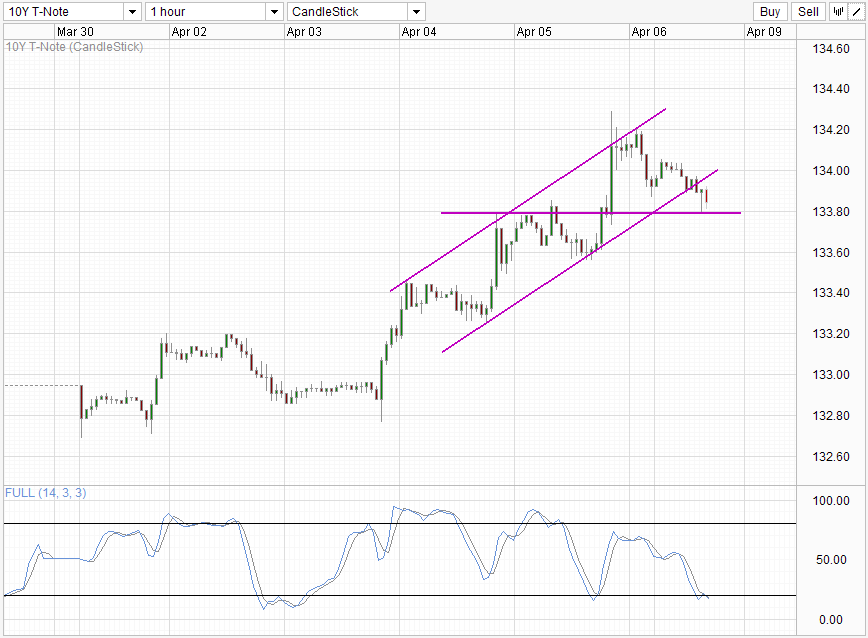
Short-term chart is pointing higher. Price has taken a recent setback with the rising channel broken. However, 133.8 will continue to provide support and that may allow price to retake 134.0 back into the rising Channel if a bounce materialize. A break below 133.80 will open up 133.6 and 133.4 as interim support, with 132.65 – 133.2 consolidation zone a potential short-term bearish objective should all the interim support have been broken.
Overall, both Long-term and Short-term charts are pointing higher, which is in-line with the long-term fundamental outlook. This week’s FOMC meeting minutes may provide further confirmation to current market sentiment and we could potentially see prices pushing higher if Fed appears to be unwilling to stop QE. Demand in US bonds can also be improved further with Japanese Government Bond yields hitting record lows due to BOJ intervention. Traders could afford to borrow funds at record low prices, and use the funds to purchase other sovereign bonds. This is evident via bond prices increasing in Australia and across Europe. Even Greek and Spanish yields have fallen to recent low – suggesting improve demand. Though US/Japan bond spreads are extremely low due to Fed’s QE, the increase demand of bonds will certainly help to keep US Treasuries supported in the near future.
More Links:
USD/JPY – Starts Week Off With a Bang
Week in FX Americas – Loonie Had More than ‘A’ Wing Clipped
Week in FX Europe – EUR Whipped Into Frenzy By NFP
This article is for general information purposes only. It is not investment advice or a solution to buy or sell securities. Opinions are the authors; not necessarily that of OANDA Corporation or any of its affiliates, subsidiaries, officers or directors. Leveraged trading is high risk and not suitable for all. You could lose all of your deposited funds.

Mingze Wu
Latest posts by Mingze Wu (see all)
- European Bourses Not Enjoying Bullish Winds From US Stocks - 17 April 2014
- More Aggressive Stimulus Possible Despite Premier Li’s Denial - 17 April 2014
- China March FDI -1.5% Y/Y vs +2.05% expected. First decline in more than a year. - 16 April 2014