Gold has seen some slight uptick recently, with price pushing above the 1,585 ceiling which has been in play since 1st March. The previous resistance turned support is now keeping price afloat after the recent failure to test 1,600 in any meaningful way.
Hourly Chart
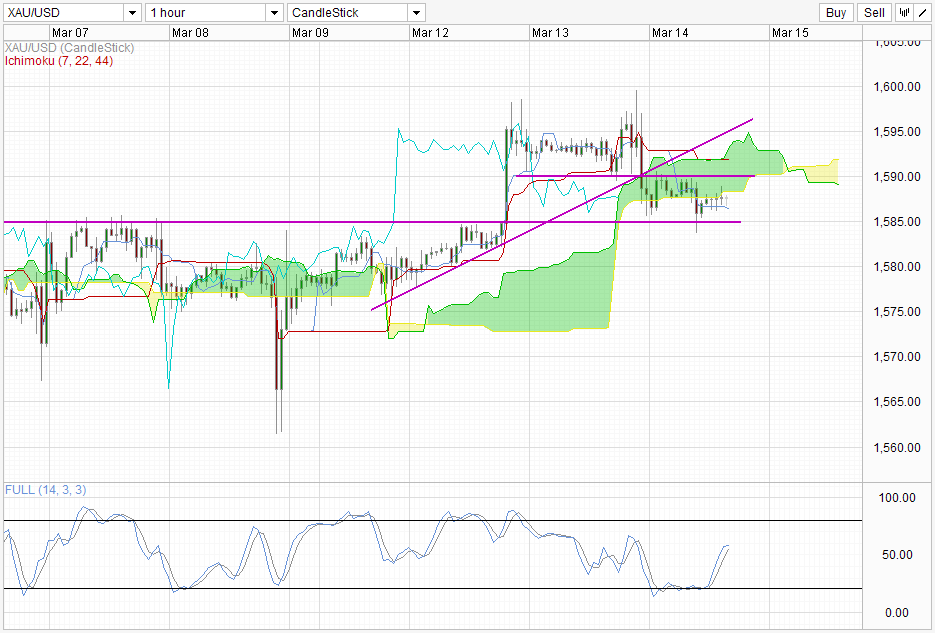
Prices is looking bearish currently. Forward Kumo is bearish, while price is trading below current Kumo after piercing through it during US trading session. Though Stochastic readings are rebounding higher, price levels have not recovered in similar fashion, and remains pushed lower by current Kumo. We could potentially see price finding further resistance back at 1,590 at best when Stoch readings reaches Overbought regions, which gives us a strong bearish divergence signal in-line with what Ichimoku is telling us.
Price rallied initially during early US hours after Advance Retail Sales appeared to be much better than expected – pushing price above 12th Mar highs. Subsequently, the disappointing growth in US Business Inventories pushed Gold prices sharply lower to bring us to current state. This tells us 2 things: 1) Gold is currently positively correlated to bullish news, which can prepare us for future news releases, and 2) There are strong bears out there still looking to short Gold close to 1,600.
Daily Chart
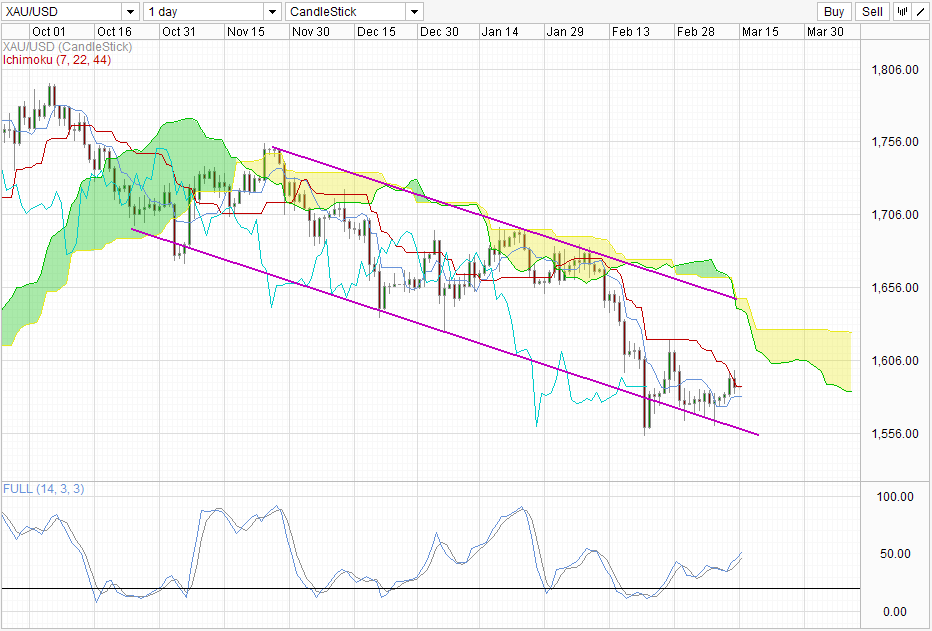
Daily Chart is also firmly on the bearish front as descending channel remains in play. Though price is re-bouncing from the Channel Bottom, resistance can be found in the form of the bearish Kumo and Channel Top. To reaffirm bullish intentions, price should preferably trade above 1,620, the swing high back in 28th Feb and also Jan low. But even so, a bullish breakout from the Kumo and trading above 1,650 may give bulls more affirmation to see acceleration to the upside.
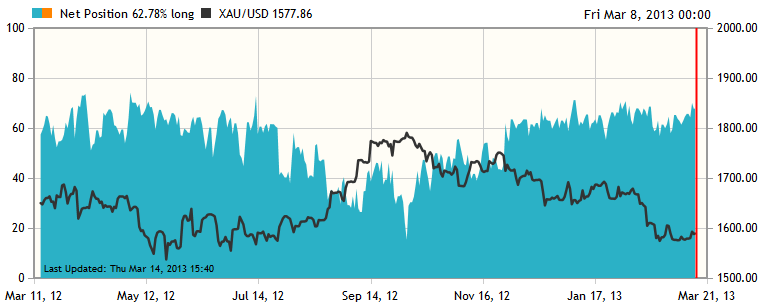
OANDA Open Position Ratios is also showing increasing bullish holders within OANDA clients. Open Position Ratios is generally a contraion indicator as seen by the falling of prices when the long ratios increases vice versa. This should automatically lead to the conclusion that bias is on the downside, though it is pertinent to note that the ratio is approaching all time high – higher likelihood for ratios to fall and hence price to increase (see May 2012). This is in line with a strong long-term Bear Trend and a short-term Bull Trend. Continue to keep close watch as bullish sentiment in the market (Dow hitting 9 day winning streak) will help to push a +ve beta Gold.
More Links:
NZD/USD – RBNZ wants lower NZD
AUD/USD – Tremendous Employment Data send Aussie Soaring
EUR / USD Drops as EU Data Disappoints and US Retail Sales Beats Expectations
This article is for general information purposes only. It is not investment advice or a solution to buy or sell securities. Opinions are the authors; not necessarily that of OANDA Corporation or any of its affiliates, subsidiaries, officers or directors. Leveraged trading is high risk and not suitable for all. You could lose all of your deposited funds.

Mingze Wu
Latest posts by Mingze Wu (see all)
- European Bourses Not Enjoying Bullish Winds From US Stocks - 17 April 2014
- More Aggressive Stimulus Possible Despite Premier Li’s Denial - 17 April 2014
- China March FDI -1.5% Y/Y vs +2.05% expected. First decline in more than a year. - 16 April 2014