Dow Jones extends winning streak to 10, the longest since 1996. Historically, the Dow has only managed such a feat 24 times prior in the last 70 years. The longest all-time streak is 14 days back in 1897, while the longest modern day record is one shy at 13 days back in 1987. It is certainly not unusual for price to clinch a 10 day streak or perhaps longer, considering that we’ve managed to break the all-time high of Dow Jones 2 weeks ago – banishing the financial crisis demon that has been lingering since 2007. Fresh new highs, fresh new start, fresh bout of bullishness – higher Dow. It is not really rocket science here, but just a reflection of all the pent-upped bullishness of traders from all corners of the world.
The question we need to ask is this – how far will this winning streak last? Is this a good price to buy for those of us that may have missed the boat?
Lets put it this way a streak of 10 is impressive, but it is just a number. Lets just say hypothetically Dow went on to print 13 day winning streak, and then 14 day winning streak, what then? Will the increasing number spur traders to be even more bullish than ever, or will bulls be contented that they’ve conquered a new record and offload their positions immediately after? Statisticians can point to the fact that likelihood of extreme numbers extending decreases (which is the basis of all oscillator indicators anyway), yet the mere fact that price has reached such stupendous levels has demonstrated that current situation is not of the ordinary. As such, it remains to be seen whether standard probability curves apply to their analysis of future likelihood.
At the end of the day, we can never predict the future. The only thing that we know currently is this: Bullish sentiment remains strong, and there is no evidence that sentiment is going to reverse. Is this good reason for traders to enter? Well, it is a reason, but lets weigh other evidences – the rally has started since mid Nov 2012, with the breakthrough in early Jan signalling strong bullish intent after the downtrend from 13,650 has been invalidated. Current winning streak is a bullish continuation of the breakout from consolidation channel above 14,000. Trend traders could have entered on any of the significant breakouts before, and entering right here right now would be chasing the rally. What about shorting now? Trying to sell currently on a strong uptrend is considered taboo for trend traders. Whether or not you believe this mantra is profitable or not, the lack of evidence of bearish momentum should not trigger short sellers to sell aggressively as well.
Daily Chart
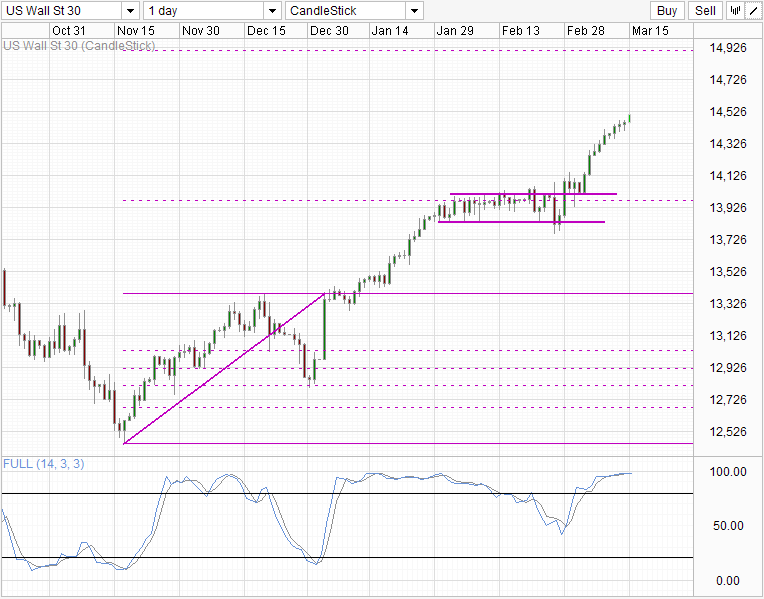
Stochastic on the daily chart is approaching 100, the absolute Overbought value. However readings are generally not reliable during extraordinary circumstances (see BOJ impact on Yen and Nikkei), similar to pure statistical analysis. Price has cleared the 161.8% Fib extension from the initial invalidation of breakout and is moving towards the next extension level of 261.8%. Even if traders believe in this Fib’s application, it will still be folly to simply enter right now seeking ~14,900 target as price could still head lower without invalidating the current setup.
Hourly Chart
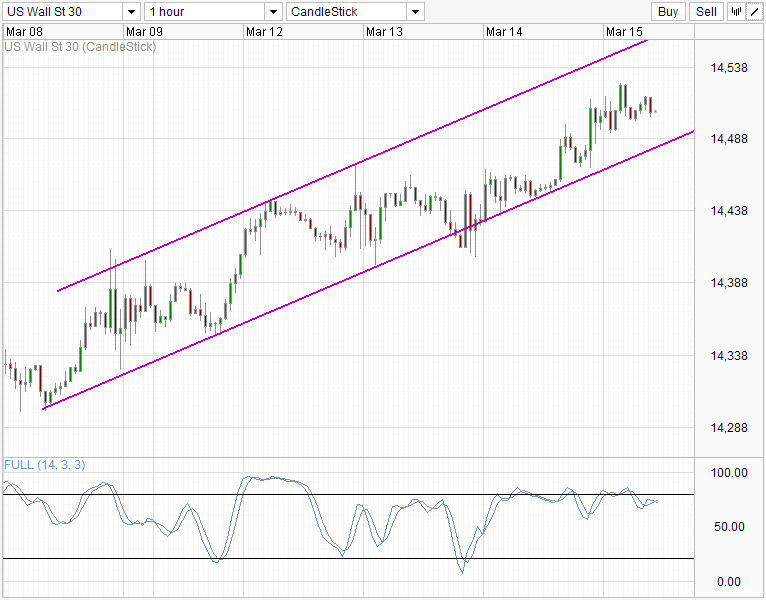
Short-term chart is also on the rise, and trading right in the middle of the Channel, which in itself is directionally neutral. Stochastic readings is hinting a bear cycle is on the way, but trading this bear signal would be trading against the major trend – similar problems that we face on the Daily Chart.
Ultimately, traders will have to decide for themselves whether the risk reward is worth entering the market right now. Playing the chasing game halfway mid trend is dangerous as comfortable support levels are generally further away, making stop losses placement wider. That does not mean that the trade will fail, just that traders must be aware of the risks involved rather than entering traders just because price hit mythical levels/numbers.
More Links:
USD/ CAD – Pair Remains Rangebound as US Numbers Sparkle
GBP/ USD – Pound Surges as US Employment Numbers Sparkle
This article is for general information purposes only. It is not investment advice or a solution to buy or sell securities. Opinions are the authors; not necessarily that of OANDA Corporation or any of its affiliates, subsidiaries, officers or directors. Leveraged trading is high risk and not suitable for all. You could lose all of your deposited funds.

Mingze Wu
Latest posts by Mingze Wu (see all)
- European Bourses Not Enjoying Bullish Winds From US Stocks - 17 April 2014
- More Aggressive Stimulus Possible Despite Premier Li’s Denial - 17 April 2014
- China March FDI -1.5% Y/Y vs +2.05% expected. First decline in more than a year. - 16 April 2014