Gold has been trading sideways on for the past week with price unable to make a push above 1,585, nor a move below 1,570. Despite the improvement in stock prices, Gold prices have failed to produce new lows (if one treats Gold as a safe haven), or new highs (if one treats Gold as a speculative commodity which has a high beta, akin to Crude Oil). Perhaps Gold price behavior is a reflection of market sentiment: Economic data are somewhat improving, with a few disappointment along the way. On the other hand, Central Bankers continue to spew dovish statements without doing anything much. These conflicting signals are impeding any strong trends to emerge. Yes Gold is still reacting mildly to news releases, but the follow-through on either side has been found lacking, and perhaps will continue to be wanting as long as we fail to have a clear sign that economy is picking up, or Central Bank will/will not ease.
Hourly Chart
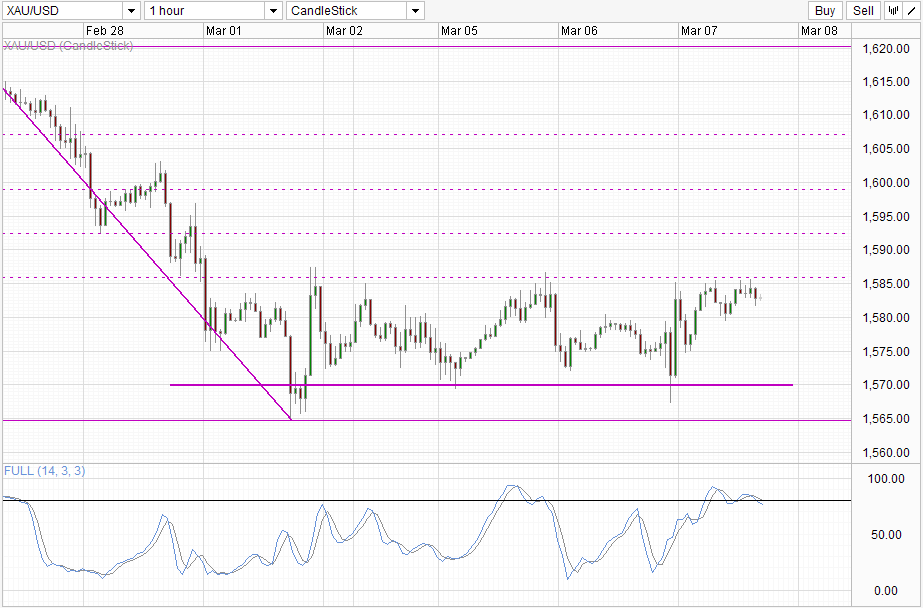
Stochastic readings is suggesting that price will embark on a bear cycle below the 38.2% Fib retracement towards 1,570, though a move towards the low of 1,565 is also possible without triggering a bearish breakout signal. A move higher above 1,585 will open up the next Fib as bullish objective, which is the confluence with the minor top on 28th Feb and the swing low on the same day.
Daily Chart
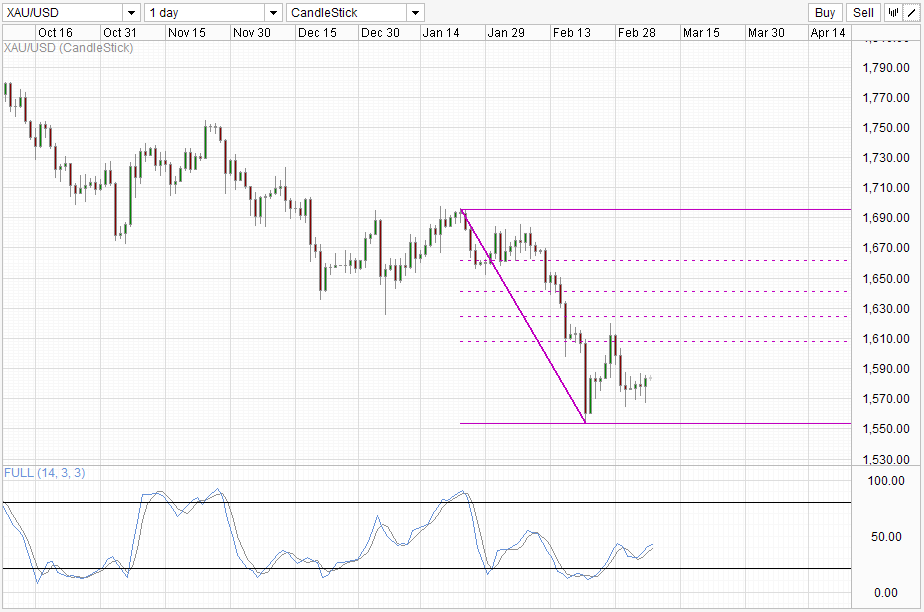
Current long term bear trend is still in play, with the 38.2% Fib rebound affirming the bearish momentum. However, it is interesting to note that stochastic readings is still pointing higher, suggesting that the rebound from the 1,550 low is not over yet. Ultimately, even a move towards the 50% Fib may not be enough to rekindle bullish momentum. We could only potentially see bullish momentum accelerate should price break above the 61.8% and 76.4% Fib which are confluence with the structural supports of price action since Dec 2012. Without any clarity in fundamental , it is hard to imagine price being able to break above or below current Daily Chart consolidation zone, but volatility can still be expected within the range band in the near future.
More Links:
GBP/USD – Moves to a New Low Below 1.50
AUD/USD – Pressure Mounts on the Key 1.02 Level
EUR / USD – Drops Below Key Support Level at 1.30
This article is for general information purposes only. It is not investment advice or a solution to buy or sell securities. Opinions are the authors; not necessarily that of OANDA Corporation or any of its affiliates, subsidiaries, officers or directors. Leveraged trading is high risk and not suitable for all. You could lose all of your deposited funds.

Mingze Wu
Latest posts by Mingze Wu (see all)
- European Bourses Not Enjoying Bullish Winds From US Stocks - 17 April 2014
- More Aggressive Stimulus Possible Despite Premier Li’s Denial - 17 April 2014
- China March FDI -1.5% Y/Y vs +2.05% expected. First decline in more than a year. - 16 April 2014