Dow Jones Industrial Average clinched a record high yesterday, marking a key milestone for US’s road to recovery. The Dow closed at 14253.77 after gaining 125 points, higher than the previous record in 2007. However, there was no massive sense of euphoria or champagne breaking on the floor of New York exchange. In the years long gone by, whenever a stock index hit new highs, or breach a significant round number e.g. 14,000 for the Dow, brokers and traders will breakout with big banners and loud applause. Perhaps the market is not enjoying this victory as it has been tainted mostly by the aggressive Fed injecting liquidity to prop up the failing economy. On the more practical side of things, the lack of euphoria is a silent nod that the market is still concern over the sequesters cuts that are yet resolved. So is this new high the start of more to come? Or are we still looking at the same old gloomy outlook where market is jittery at every perceived bad news?
Hourly Chart
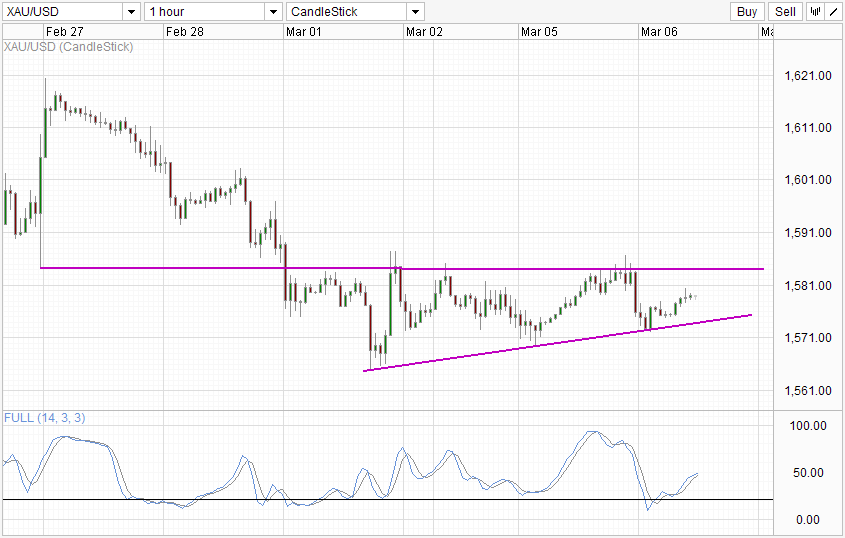
Gold, the universally regarded “safe haven” currency traded lower early US trade. However, the lows of yesterday is still a fair distance away from the lows on 1st March. Price even failed to test the lows of 5th Mar, making it hard to establish a bearish outlook for the past 3 trading days. In fact, the reaction of Gold is so muted that one could hardly tell that something extraordinary happened in the market purely looking at the chart.
Daily Chart
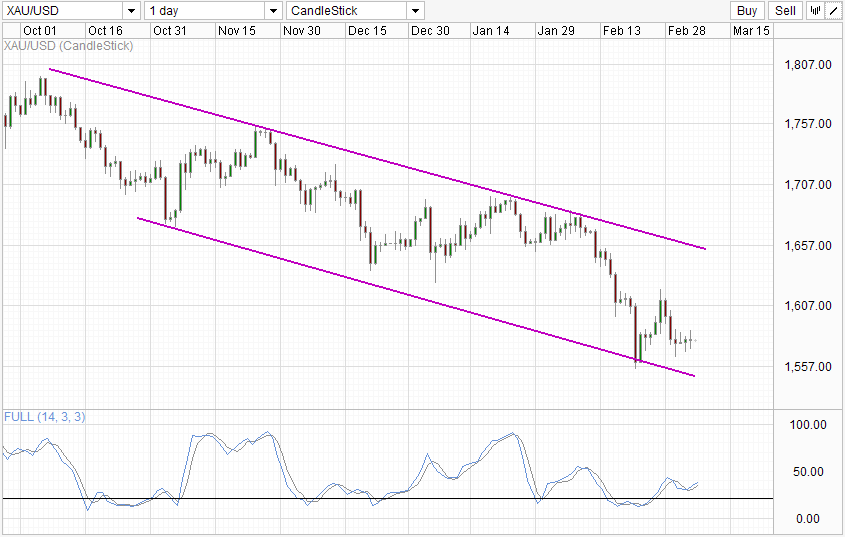
Granted that on the daily chart, price is trending lower due to renewed optimism which saw S&P 500 climbing from 1,400 to 1,500 and beyond. Though a part of the decline is due to bulls overextended themselves in 2011 after QE 1 and 2. It is hard to see any significant breakthrough in Gold due to risk sentiment, but rather Gold appears to be heavy due to 1,600 resistance confirming the bearish breakout below the aforementioned level. Stochastic reading remain bullish, with a recent Stoch/Signal cross suggesting price and readings could head higher in the next few trading periods, potentially re-testing 1,600 resistance once more.
Looking at both long-term and short-term charts, it seems unlikely that closet bulls will suddenly come out in the open after the new milestone. As such, stocks prices may not simply fly higher from here out, and a pullback from the high remains likely. Looking at US Yields, 10Y T-note prices is still above 132.50, though price has climbed down quite a fair bit from the recent high of 133.25, which tells us the same thing as Gold. Yes new highs are good, but fear in the market is far from gone.
More Links:
AUD/USD – Better than expected GDP spurs Aussie
GBP/USD – Trying Desperately to Climb Off the Canvas at 1.50
EUR / USD – Selling Pressure Continues on the Support Level at 1.30
This article is for general information purposes only. It is not investment advice or a solution to buy or sell securities. Opinions are the authors; not necessarily that of OANDA Corporation or any of its affiliates, subsidiaries, officers or directors. Leveraged trading is high risk and not suitable for all. You could lose all of your deposited funds.

Mingze Wu
Latest posts by Mingze Wu (see all)
- European Bourses Not Enjoying Bullish Winds From US Stocks - 17 April 2014
- More Aggressive Stimulus Possible Despite Premier Li’s Denial - 17 April 2014
- China March FDI -1.5% Y/Y vs +2.05% expected. First decline in more than a year. - 16 April 2014