The Dow rallied 175 points on Wednesday to a fresh 5-year high, surpassing the highs of 23rd Feb that preceded the largest sell-off in 2013 after Italian Parliamentary elections results were less than satisfactory. Since then, we’ve seen a slew of good news coming from US – Consumer Confidence Hit 69.6 despite threats of sequester cuts, New Home Sales came in at 437K, the highest since 2008 while Pending Home Sales grew 4.5% M/M. Core Durable Goods Orders also grew 1.9% while Manufacturing Index from Richmond area came in at +6, versus -4 expected and -12 previous. All these positive data lifted US Stocks across industries, which included Dow Transportation Index.
According to Dow Theory, a bullish signal is generated when both Transport and Industrial averages points up. While that has been the case for Transport, which has been logging new highs, the Industrial counterpart was weaker in this regard, with 14,000 levels looking shaky at the best of times. However, the resurgence of bulls helped to push price within a few points of all-time historical high is giving new hopes that 14,000 may be able to hold its own, and lend credence to the bullish Dow Signal.
Hourly Chart
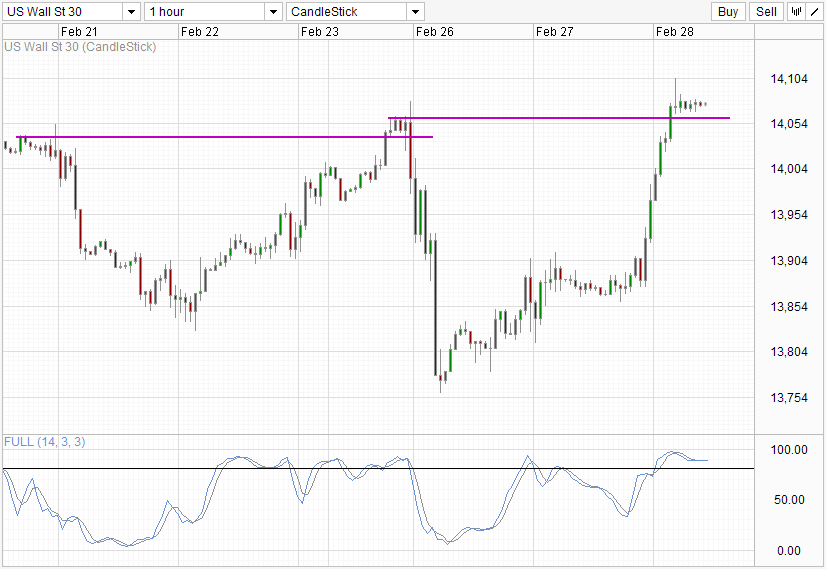
Price is showing bullish intent by finding support just above the previous swing high. However before we get too excited, note that the previous swing high on 23rd Feb was also just sitting above the swing highs of 20th Feb, just before the catastrophic collapse. Granted that the collapse is due to an unexpected event, and without which we could have seen prices hitting fresher highs much earlier, instead of waiting 2 days later. Nonetheless there is also another risk event in the horizon tomorrow – Sequester Cuts. The market believes that he cuts will not happen, placing their trusts in the US Government sorting themselves out. That is certainly not misplaced confidence, as even President Obama has said that these cuts is a “bad idea” with Ben Bernanke openly sounding out his concerns for the cuts as recent as last night during his Testimony to the Congress.
Weekly Chart
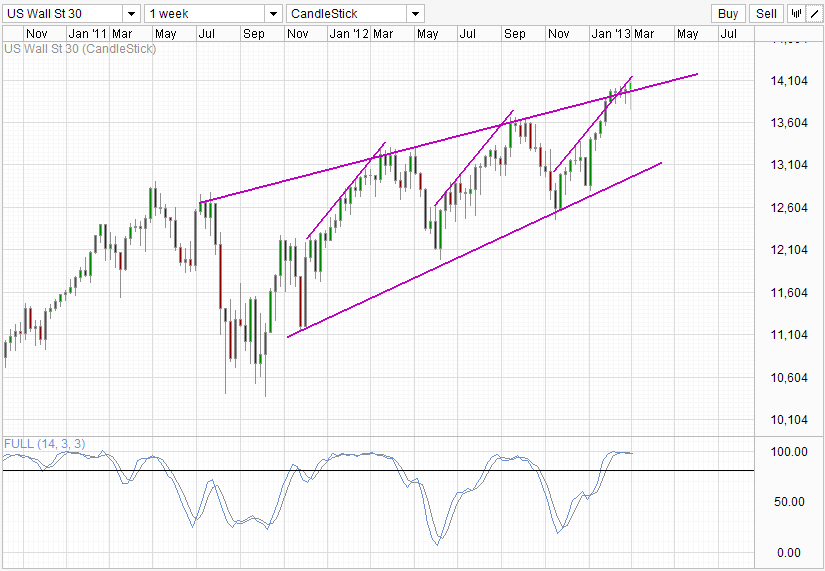
Weekly Chart is more bullish with candles breaking away from the rising wedge’s top. Prices was threatening to break back into the wedge earlier this week but that appears to be foiled, which underline the strong bullish sentiment the market is having currently. However, if we were to use the previous 2 rallies for reference, current rally could be near its end. All 3 lines have the same length and angle (though it may appear not to be due to the wedge causing parallax error), and the turn around happened generally 1-2 candle after the line ends. Each swing high is also marked by Stochastic Peaks nearing 100.0, which enhances the temporary pullback scenario. Hence traders should certainly not bet their house on the Dow Theory bullish signal and be mindful of the potential pitfalls.
More Links:
GBP / USD – Finding Comfort at the Support Level at 1.51
AUD / USD – Trying to Stay Above Key Support at 1.02
EUR / USD – Rallies Back Above 1.31
This article is for general information purposes only. It is not investment advice or a solution to buy or sell securities. Opinions are the authors; not necessarily that of OANDA Corporation or any of its affiliates, subsidiaries, officers or directors. Leveraged trading is high risk and not suitable for all. You could lose all of your deposited funds.
Latest posts by marketpulsefxstaff (see all)
- Oil Remains Near Multi-Month Lows - 6 August 2015
- U.S. Dollar Higher on Recent Data - 6 August 2015
- Greece’s PM Tsipras: Loan Deal with Lenders Close - 6 August 2015