GBP has been on the backfoot for a major part of 2013. After climbing to the 2013 high ~1.638 against USD post “resolution” of US Fiscal Cliff, price saw one way traffic lower, losing more than 1,000 pips since. A large part of the decline is due to the ailing UK economy, with Bank of England heavily speculated to expand its easing program sometime in 2013. Indeed during the latest Inflation Report and the recent minutes, BOE has expressed desires to “ease if necessary”, which affirmed speculators beliefs and stroke further selling.
Last week’s better than expected employment data provided some reprieve for the bulls, but against a strong bearish backdrop, it wasn’t difficult for bears to overtake once again. To worsen matters, Moody’s became the 1st Credit Rating Agency that downgraded UK’s Sovereign Rating from AAA to Aa1, rousing further speculations that S&P and Fitch may follow suit. GBP weakened further, pushing various GBP crosses below support, and GBP/NZD bears are not the only benefactors from last Friday’s development, but they have reached a significant historical low milestone.
Hourly Chart
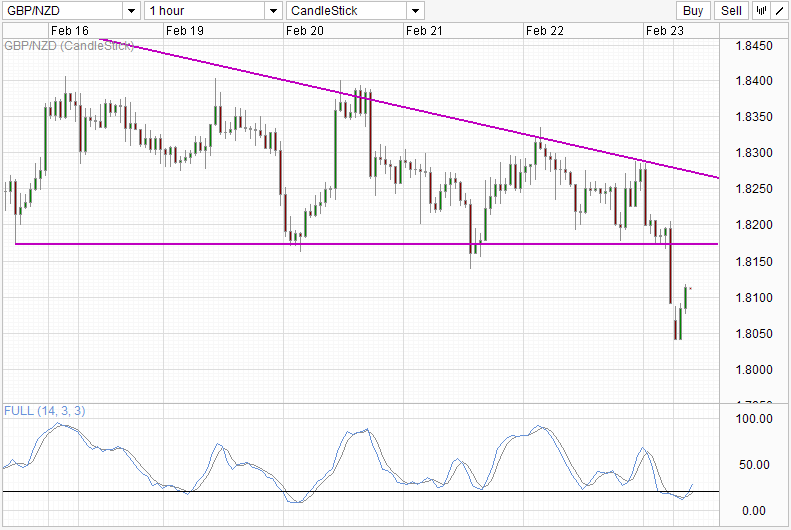
Price has rebounded slightly 50 pips higher from 1.805, however the overall bias remains bearish after the breakout below the support level around 1.8175. Do be wary of a short-squeeze scenario though as price has tagged a historical low, and short sellers may take profit temporarily to push prices higher. Stochastic indicator also suggest a short-term pullback higher is possible with readings now heading above 20.0 after a Stoch/Signal cross. Nonetheless, overall trend is still down (as seen from the downward sloping trendline), hence the onus is on the bulls to prove that they are able to make a comeback to push back above 1.8175, and even that may not be enough against to strong bearish backdrop as the downward trendline will continue to weigh heavily on rallies.
A more likely scenario will see price potentially failing to break 1.8175 and begin to trade lower, with stochastic readings closer to 50.0 for a bearish restart, similar to what we’ve previously seen on Feb 19 and Feb 21.
Weekly Chart
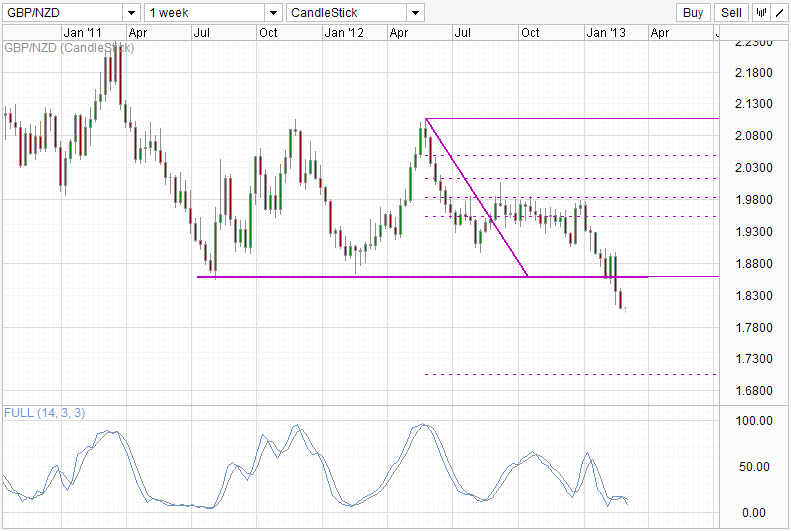
On the longer term chart, a breakout appears to be underway. However, as price is entering uncharted territory, it is hard to pinpoint where exhaustion may take place for the bears. Fib extension from the trading range of 2012 (and consolidation range between 1.86 – 2.105) may help to provide some reference price level, however shorter-term traders may find nearer reference levels using Classical Pivots and/or Camarilla Pivots for their perusal.
Fundamentally, NZD strength is getting suspect after RBNZ’s surprise dovish turn last week. With this, the ability for GBP/NZD to reach Fib extension level becomes less likely, and opens up the possibility for price to bounce higher back into 2012 trading range, to negate current price action as a false breakout. However as mentioned above, the onus is on bulls to prove that to us due to the strong bearish technical movement that we are looking at right now.
Your move, bulls.
More Links:
AUD / USD – Trying to Cling on to 1.03 Again
GBP/USD – Under Pressure as UK Economy Worries Markets
This article is for general information purposes only. It is not investment advice or a solution to buy or sell securities. Opinions are the authors; not necessarily that of OANDA Corporation or any of its affiliates, subsidiaries, officers or directors. Leveraged trading is high risk and not suitable for all. You could lose all of your deposited funds.
Latest posts by marketpulsefxstaff (see all)
- Oil Remains Near Multi-Month Lows - 6 August 2015
- U.S. Dollar Higher on Recent Data - 6 August 2015
- Greece’s PM Tsipras: Loan Deal with Lenders Close - 6 August 2015