Despite 2 hairy weeks in Jan which bond prices climbed due to US uncertainty, bullishness appears to be the 1st act of 2013. Within Jan, we saw S&P 500 climb above 1,500 and last Friday DJIA finally caught up with price clearing 14,000 mark. That is the same week which saw US 10Y T-Note prices break 132 convincingly, leading to where we are today.
US 10Y T-Note Weekly Chart
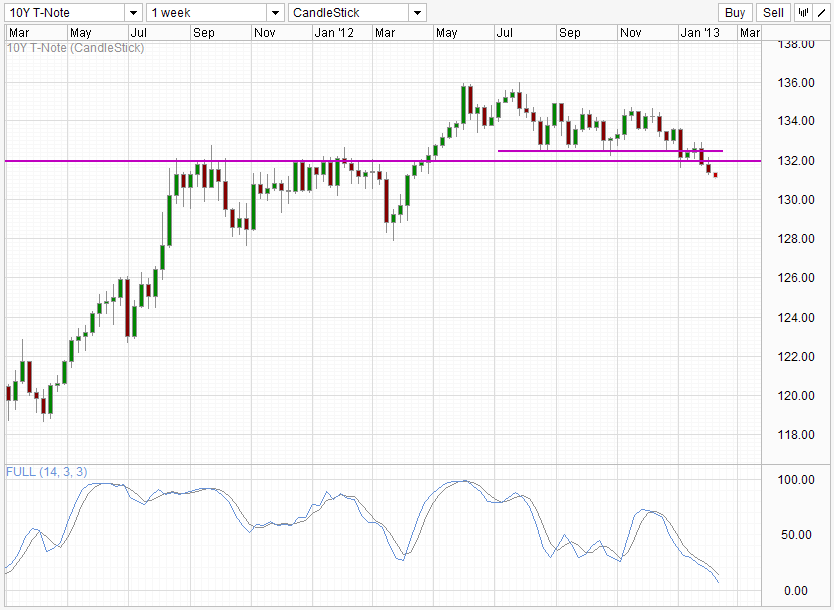
Weekly chart showed price breaking 132.50 at the start of Jan 2013, but failed to push below significant resistance turned support along 132. The resultant recovery reached above 132.5 but was quickly put down once more, confirming the bearish breakout of 132.5 which allowed price to break 132.0 at the 2nd time of asking. Currently, price looks to head lower with 130.0 and 128.0 providing support, and a break below 128.0 potentially accelerating selling of bonds to reach 120.
US 10Y T-Note Hourly Chart
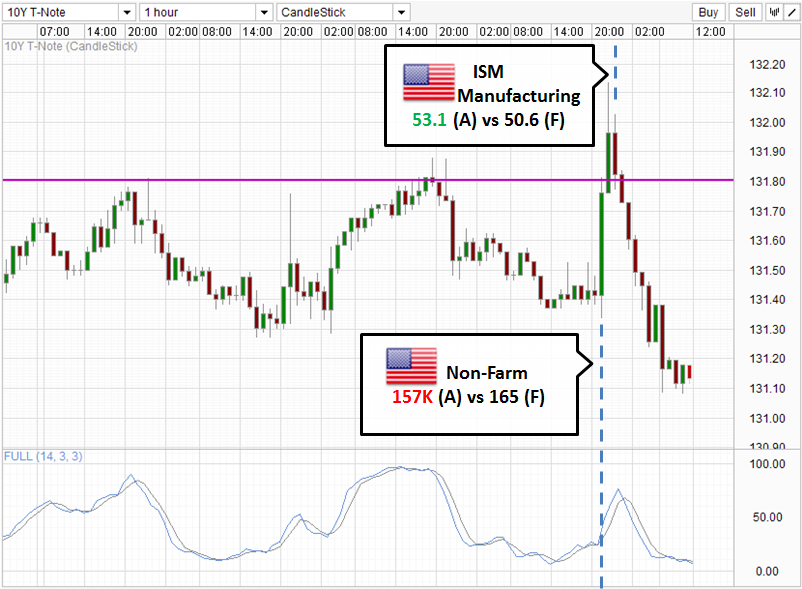
Treasury yields are one of the best indication of risk appetite, and recent developments of NFP and ISM Manufacturing clearly indicates the sensitivity yields have on risk. Worse than expected NFP print resulted in an immediate rally to above 132.0 levels. Bears will be glad that the better than expected ISM print allow prices to slide lower and affirm the 132.0 breakout on the short-term chart, aiding bearish sentiment in similar fashion to how 132.50 held.
DOW Futures Hourly Chart
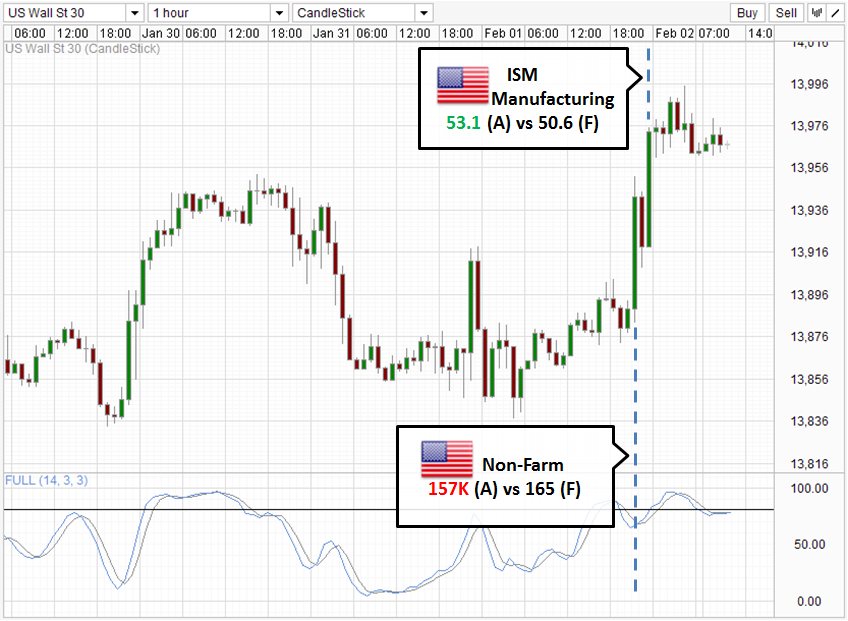
Strangely, the same NFP figures resulted in prices rallying for DOW, instead of sending it lower due to risk-aversion. ISM Manufacturing on the other hand produced bullish behaviors as expected. Does that mean that the Non-farm payroll print was somehow “good” for the economy? Certainly not. A plausible explanation is that market expects a stay of action from the Fed to cut QE3 after a weaker than expected NFP, resulting in stock prices actually increase counter-intuitively. A continuation of QE3 with a possibility of further easing expansion will have bond prices rising as well, as market start to purchase bonds in order to “front run” the Fed, and sell to the Fed eventually.
DOW Futures Weekly Chart
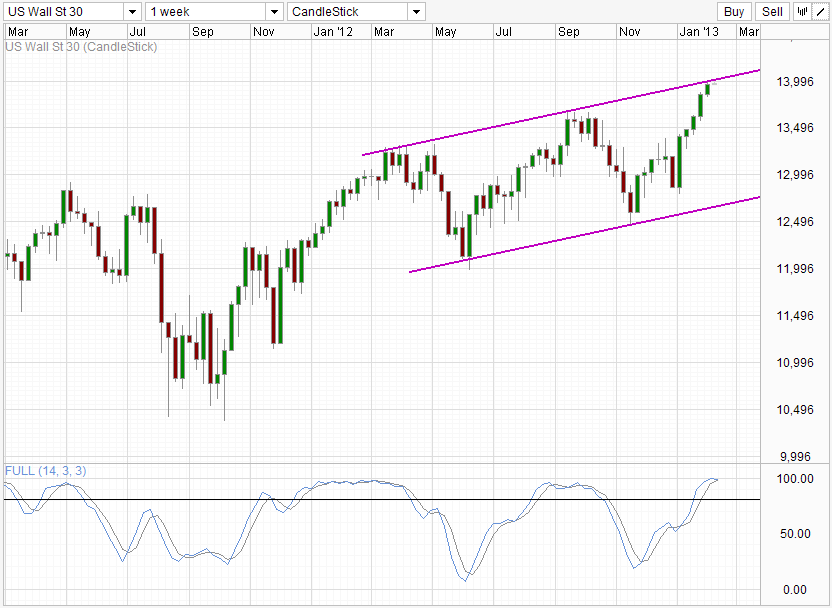
This understanding is important because it suggest that current rally in stocks may not be built on stable fundamental legs, but could be due to over-optimism in the market. If that hypothesis is true, the we could easily see DOW falling from its 14,000 levels back to the channel bottom. Stochastic indicator also hint at bearish sentiment with Stoch line looking to cross signal line while price is facing confluence of Channel Top and 14,000 resistance.
Bottomline: Though we are going through an undeniably bullish season, be wary of potential setbacks as current rally looks suspiciously over optimistic. Just as what Warren Buffet has said, be fearful when others are greedy, and greedy when others are fearful.
This article is for general information purposes only. It is not investment advice or a solution to buy or sell securities. Opinions are the authors; not necessarily that of OANDA Corporation or any of its affiliates, subsidiaries, officers or directors. Leveraged trading is high risk and not suitable for all. You could lose all of your deposited funds.
Latest posts by marketpulsefxstaff (see all)
- Oil Remains Near Multi-Month Lows - 6 August 2015
- U.S. Dollar Higher on Recent Data - 6 August 2015
- Greece’s PM Tsipras: Loan Deal with Lenders Close - 6 August 2015