Hourly Chart
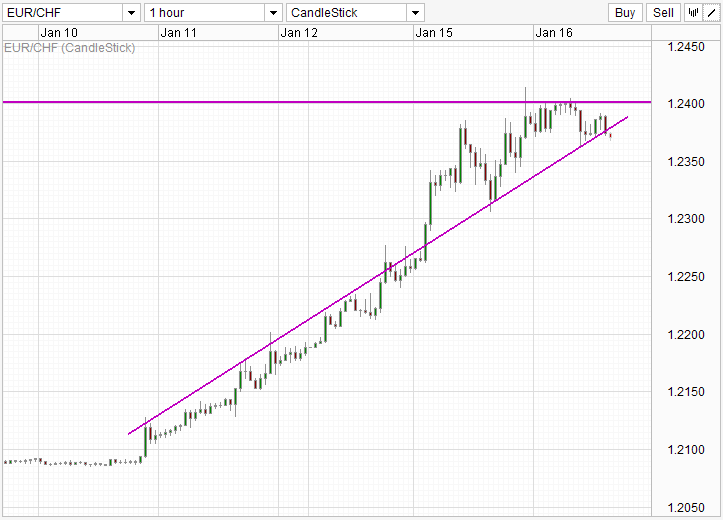
After rallying for 3 consecutive trading days, EUR/CHF bullish momentum appears to be sputtering just under 1.24. Price was trading sideways after hitting 1.24, with current period breaking to the underside of the trendline, hinting at a potential larger correction.
8 Hourly Chart
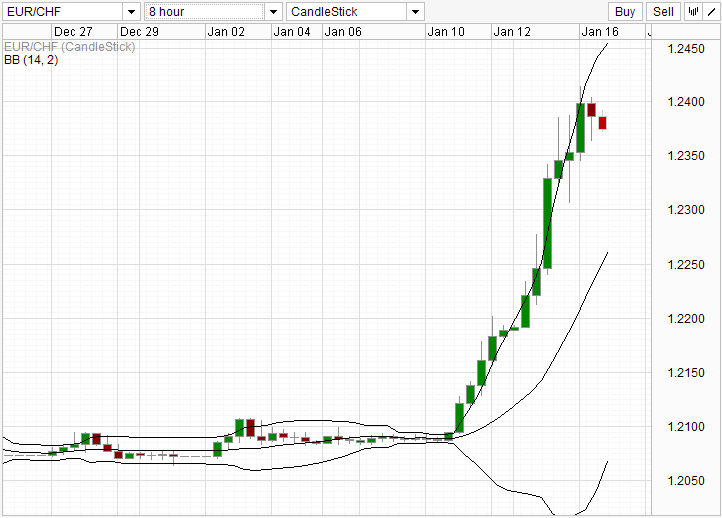
8 Hourly chart agrees, with the first 2 red candles appearing since price enjoyed the bullish breakout from 1.21. Bollinger Band further suggest that a pullback was always going to be likely – Rally started with candles having majority of its body outside the upper-band, to having the last candle’s body almost fully within the band – Slowing down of bullish momentum.
Weekly Chart
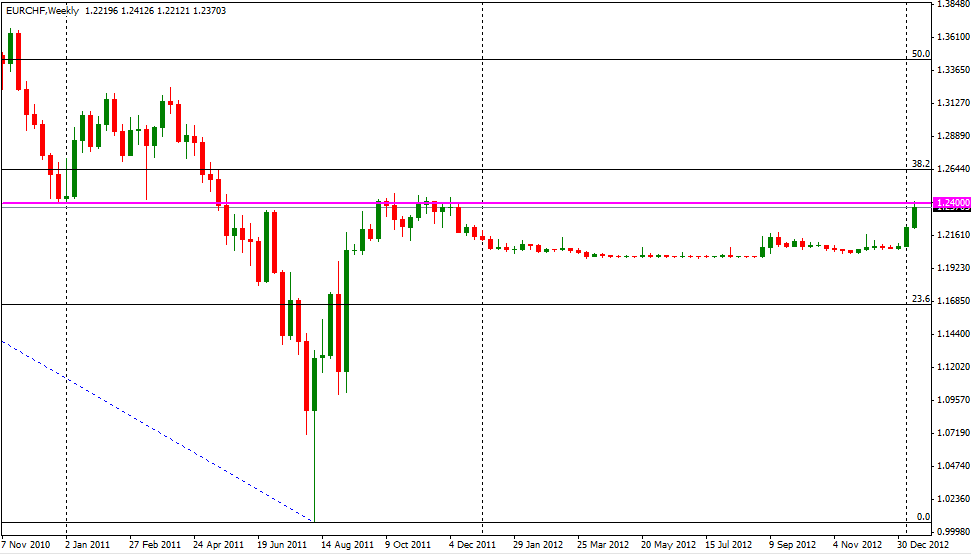
1.24 shows its influence on prices on the weekly chart. Failure to maintain current price levels may encourage short-term profit taking, adding pressure onto current price levels. Beyond 1.24, bulls may face resistance in the form of 36.2% Fib retracement from 2007 highs vs 2011 lows. Lower support can e found around 1.22, and eventually 1.20. Break beyond 1.20 is highly unlikely considering SNB’s commitment to keep its 1.20 floor, though a break may quickly push price back into 1.02 in quick fashion due to a failure of SNB.
This article is for general information purposes only. It is not investment advice or a solution to buy or sell securities. Opinions are the authors; not necessarily that of OANDA Corporation or any of its affiliates, subsidiaries, officers or directors. Leveraged trading is high risk and not suitable for all. You could lose all of your deposited funds.
Latest posts by marketpulsefxstaff (see all)
- Oil Remains Near Multi-Month Lows - 6 August 2015
- U.S. Dollar Higher on Recent Data - 6 August 2015
- Greece’s PM Tsipras: Loan Deal with Lenders Close - 6 August 2015