Hourly Chart
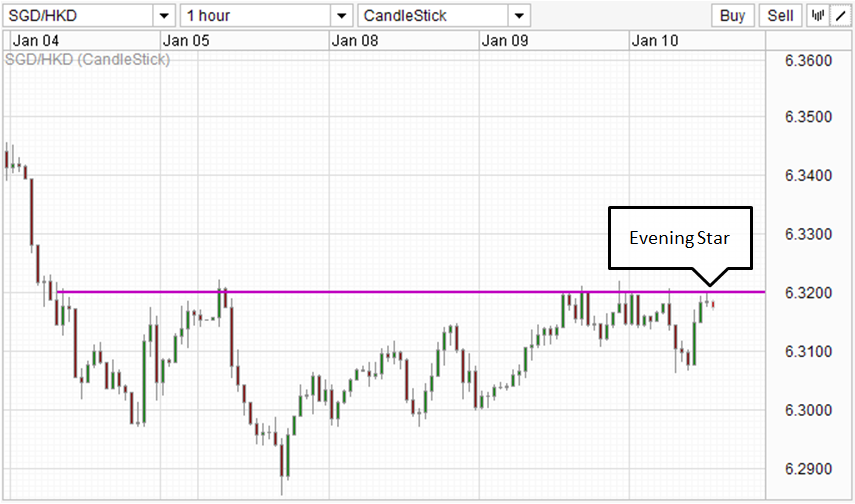
6.32 has been holding up nicely as a ceiling against SGD strength. With an Evening Star pattern forming just below the resistance, we could see bulls losing steam and price moving back to the 6.30 region.
Daily Chart
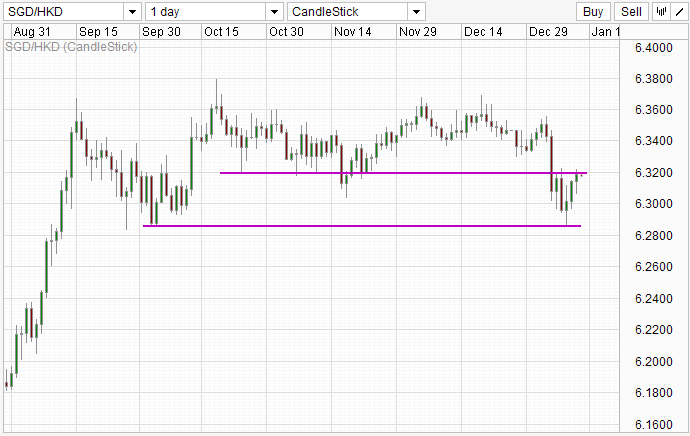
The resistance line gain more importance when we zoom out and look from the Daily Chart perspective; acting as a support for most of Q4 2012. Below this, we have 6.285 providing further support. Right now there isn’t any indication from the Daily Chart that the move from 6.285 last week is over, hence making an immediate short based on the Hourly Chart analysis risky. Furthermore, a break above 6.32 could accelerate bullish momentum as trading Q4 trading range of 6.32-6.36 comes back into focus.
Individually, USD/HKD has finally moved away from the 7.75 floor to trade marginally higher at 7.7515, slightly below a recent high of 7.7525, however, despite the recent “volatility” (or the lack thereof), USD/HKD is still relatively flat compared to USD/SGD, making USD/SGD the main driver that can possibly influence the price movement as we trade around 6.32.
USD/SGD Daily
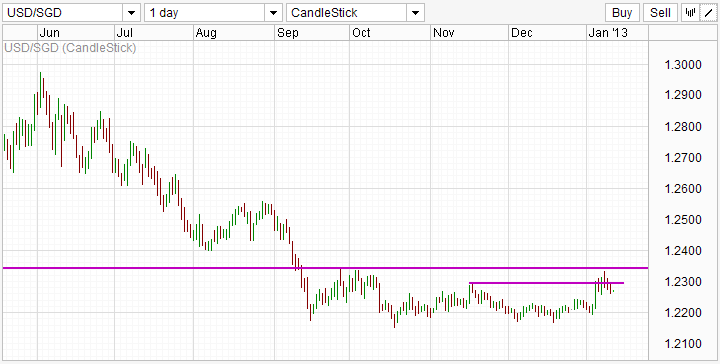
SGD continues to look strong with USD/SGD failing to break the 1.234 level, and currently trading below the previous swing high in Nov. This development may jeopardize any short SGD/HKD positions as HKD strength will be capped at 7.75 (HKMA is legally obliged to defend the 7.75 floor).
This article is for general information purposes only. It is not investment advice or a solution to buy or sell securities. Opinions are the authors; not necessarily that of OANDA Corporation or any of its affiliates, subsidiaries, officers or directors. Leveraged trading is high risk and not suitable for all. You could lose all of your deposited funds.
Latest posts by marketpulsefxstaff (see all)
- Oil Remains Near Multi-Month Lows - 6 August 2015
- U.S. Dollar Higher on Recent Data - 6 August 2015
- Greece’s PM Tsipras: Loan Deal with Lenders Close - 6 August 2015