There is really no stopping NZD/JPY, or is it? This pair has performed better than its AUD counterpart, broke a multi-year ceiling, bullish alignment of short-term and long-term trend, wow and the list goes on… But regardless, there are some important price levels that Bulls should be aware of:
Weekly Chart
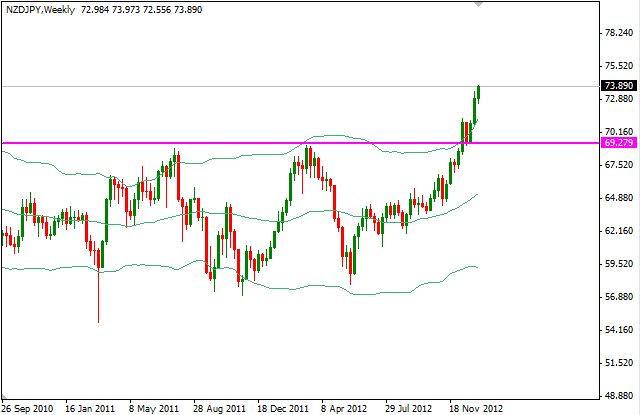
Weekly price has punch through the 52 period bollinger band. Though that is relatively common when looking at lower timeframes, it is not for higher timeframes. Lets take a look at the past few instances of such occurrence:
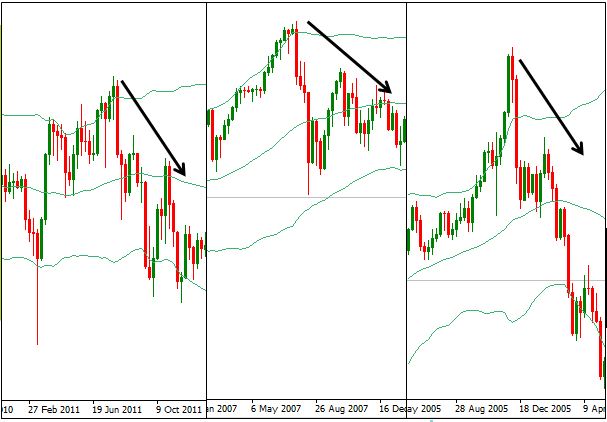
Since 2005, there has only been 3 instances where price punch out of the 52 weeks upper bollinger band. And each time it happens, the eventual pullback was significant. How far the bulls manage to punch through also has a positive correlation to the magnitude of the eventual pull back – see Dec 2005.
Beyond using bollinger bands, we can take a look at the Monthly Chart for more references:
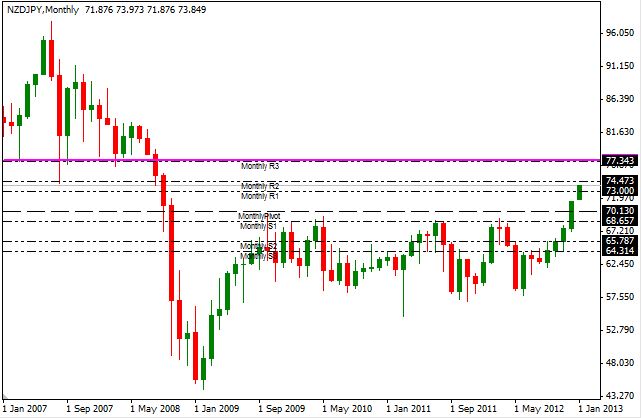
Of particular interest is the Monthly R2, which coincides with with the low of August 2007. An even stronger resistance could be found along R3, which is the confluence with support found in 2007 – early 2008.
Should a pullback occur within this month, January 2013 Monthly Pivot may provide some support, but S1/confluence with multi-year ceiling will act as further support should Monthly Pivot is broken.
This article is for general information purposes only. It is not investment advice or a solution to buy or sell securities. Opinions are the authors; not necessarily that of OANDA Corporation or any of its affiliates, subsidiaries, officers or directors. Leveraged trading is high risk and not suitable for all. You could lose all of your deposited funds.
Latest posts by marketpulsefxstaff (see all)
- Oil Remains Near Multi-Month Lows - 6 August 2015
- U.S. Dollar Higher on Recent Data - 6 August 2015
- Greece’s PM Tsipras: Loan Deal with Lenders Close - 6 August 2015