30 Minutes Chart
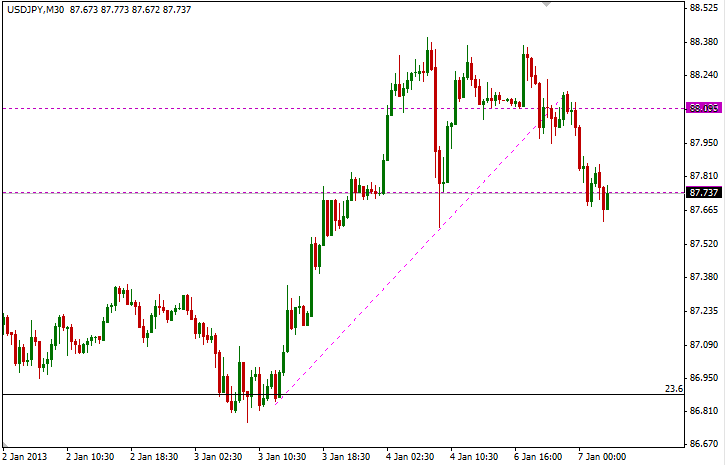
Yen strengthened early Monday which saw Asian equities trading lower. Short-term upward trendline has been broken, suggesting a slowdown/pull-back from the bullish momentum. Price is currently trading around interim support of 87.75, with a break opening up 87-87.25 trading range as a potential downside target.
Weekly Chart
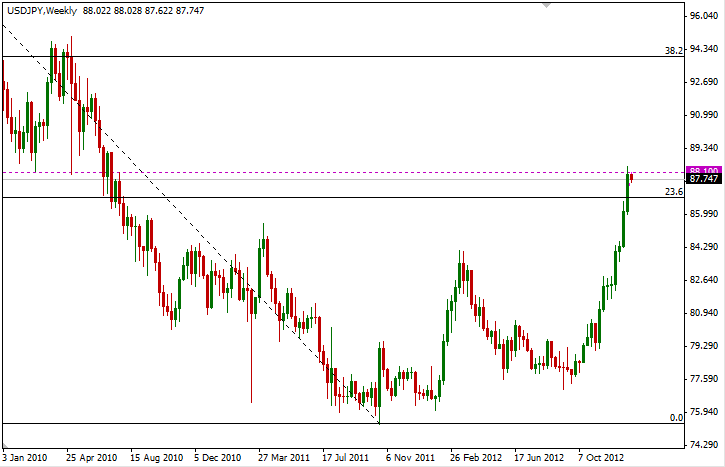
However, on the Weekly, today’s price is just a blip against the strong bullish backdrop. Nonetheless, interim support 88.10 (see chart above) is the confluence of the support found back in Q1 2010. Also, USD/JPY has seen an unprecedented 8 consecutive weekly gains that is not seen in recent years. The previous time Yen saw similar bullishness in Q1 2012, the peak was followed by a drop of 650 pips (~84 to 77.5). Hence, a sizable pullback from here is not unforeseeable, with 23.6 Fib and 84.0 potentially providing support.
This article is for general information purposes only. It is not investment advice or a solution to buy or sell securities. Opinions are the authors; not necessarily that of OANDA Corporation or any of its affiliates, subsidiaries, officers or directors. Leveraged trading is high risk and not suitable for all. You could lose all of your deposited funds.
Latest posts by marketpulsefxstaff (see all)
- Oil Remains Near Multi-Month Lows - 6 August 2015
- U.S. Dollar Higher on Recent Data - 6 August 2015
- Greece’s PM Tsipras: Loan Deal with Lenders Close - 6 August 2015