The 2 largest EU countries announced their respective Q3 GDP figures earlier, with France Q/Q and Y/Y figures coming in at 0.2% vs 0.0% expected. German figures Q/Q figures came in at 0.2% vs 0.1% expected, while Y/Y came in as expected at 0.4%.
This is certainly good news considering the dismal data coming out from Germany recently. However, EUR/USD rally was short-lived, with price hitting 1.2745 before climbing down in quick succession.
5 Min Chart
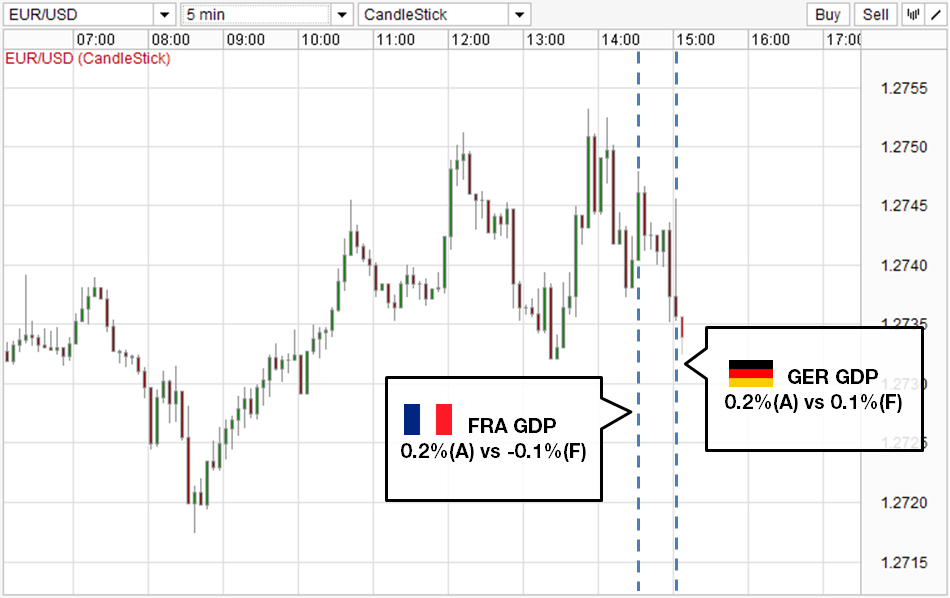
Price is testing 1.2735 interim support, with a break opening up today’s low of 1.272. Bulls should be concerned that the rally after German GDP did not even test the previous day high of 1.2753, implying strong bearish undertone in today’s trade.
Hourly Chart
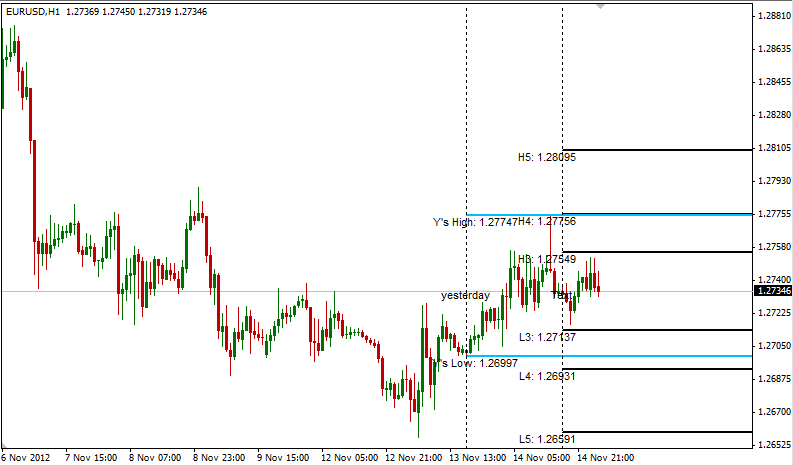
From the hourly chart, we can tell that Yesterday’s high barely hit the resistance of 1.2775 found between 7th – 8th Nov. Currently price is trading below H3, with 1.2735 acting as support against a move towards today’s L3 of 1.2715.
Spanish, Italian and Euro-Zone Composite GDP will come in later during European hour, which could help break current support if figures are lower than expected. On the other hand, a better than expected showing may only push back bearish pressure temporarily as seen by French and German GDP reaction.
Italian GDP Q/Q -0.4%(F) -0.8% (P)
Spainish GDP Q/Q -0.3%(F) -0.3% (P)
Euro-Zone GDP Q/Q -0.1%(F) -0.2% (P)
This article is for general information purposes only. It is not investment advice or a solution to buy or sell securities. Opinions are the authors; not necessarily that of OANDA Corporation or any of its affiliates, subsidiaries, officers or directors. Leveraged trading is high risk and not suitable for all. You could lose all of your deposited funds.
Latest posts by marketpulsefxstaff (see all)
- Oil Remains Near Multi-Month Lows - 6 August 2015
- U.S. Dollar Higher on Recent Data - 6 August 2015
- Greece’s PM Tsipras: Loan Deal with Lenders Close - 6 August 2015