Hourly Chart
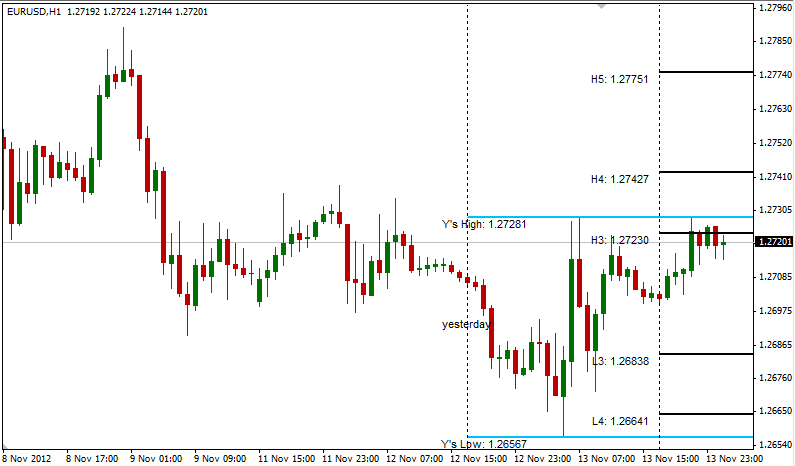
Price hit Yesterday’s high of 1.2728 but is currently trading below H3, leaving the possibility of hitting L3 open. Nonetheless, interim support could also be seen along 1.270 which was supporting price action since 9th Nov.
5 Minutes Chart
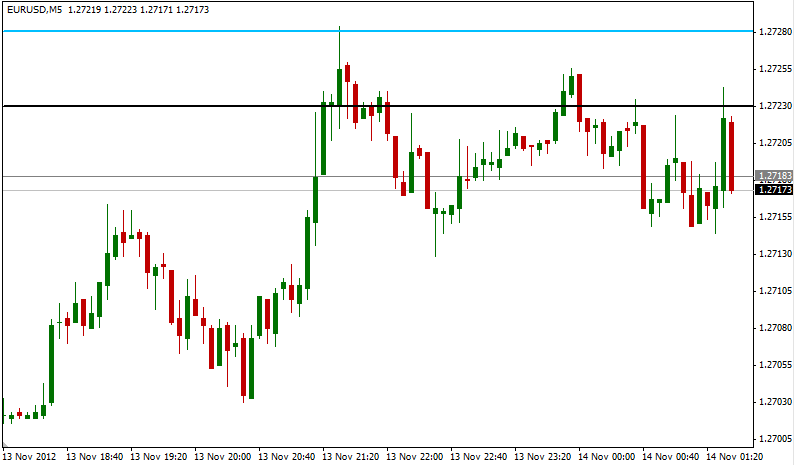
The 1.27 support is more apparent via the 5 mins chart, where price bounced off the support on 13th Nov forming a Tweezer Bottom. Currently a new interim support along 1.2715 appears with price looking to test it. A failure to hold will open up 1.270 once more, while the reverse would bring back resistance zone 1.2723 – 1.2728 back into play.
This article is for general information purposes only. It is not investment advice or a solution to buy or sell securities. Opinions are the authors; not necessarily that of OANDA Corporation or any of its affiliates, subsidiaries, officers or directors. Leveraged trading is high risk and not suitable for all. You could lose all of your deposited funds.
Latest posts by marketpulsefxstaff (see all)
- Oil Remains Near Multi-Month Lows - 6 August 2015
- U.S. Dollar Higher on Recent Data - 6 August 2015
- Greece’s PM Tsipras: Loan Deal with Lenders Close - 6 August 2015