Hourly Chart
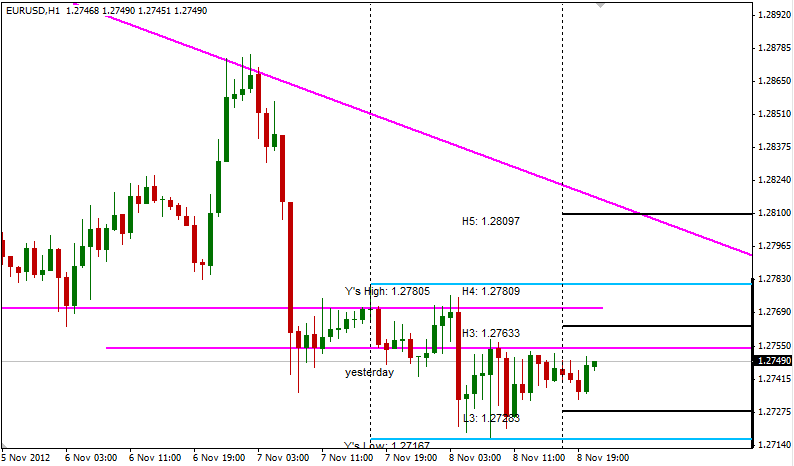
Fiber was mostly flat after ECB’s announcement yesterday. 1.277 remain a strong support/resistance while a new interim resistance can be seen at 1.2755 level. A break above may bring trading range of 1.274 – 1.277 back into focus.
Daily Chart
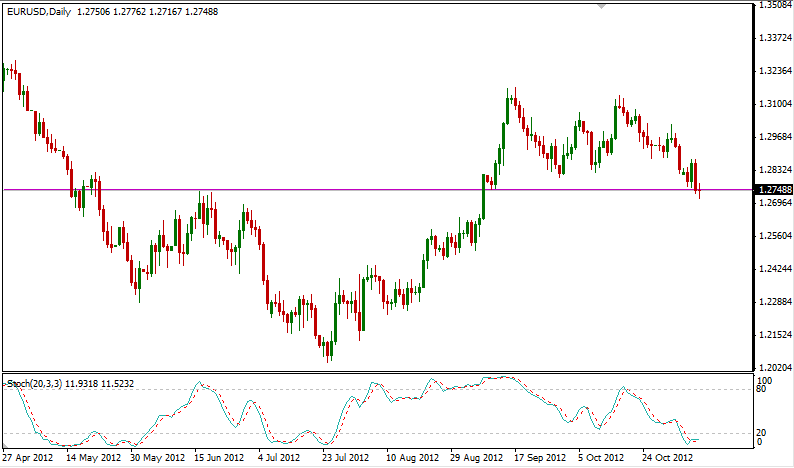
No new development on the daily chart, with price still straddling along the significant levle of 1.250 which acts as final support for the bulls. We could potentially see a Doji today should Asian trade continues to remain flat which is a neutral signal before any bullish/bearish confirmation becomes available. However, stochastic indicator is showing “Oversold”, and if we disregard price action before 23rd July, one would say that EUR/USD is in an uptrend, with current decline simply being a temporary pullback. If that interpretation is correct, and should 1.275 stay as support, this make the case for a bullish reversal even stronger. Nonetheless, traders may be wise to take note that should PA before 23rd July is taken into consideration, it becomes hard to deny that a strong downtrend pressure is still ongoing.
This article is for general information purposes only. It is not investment advice or a solution to buy or sell securities. Opinions are the authors; not necessarily that of OANDA Corporation or any of its affiliates, subsidiaries, officers or directors. Leveraged trading is high risk and not suitable for all. You could lose all of your deposited funds.
Latest posts by marketpulsefxstaff (see all)
- Oil Remains Near Multi-Month Lows - 6 August 2015
- U.S. Dollar Higher on Recent Data - 6 August 2015
- Greece’s PM Tsipras: Loan Deal with Lenders Close - 6 August 2015