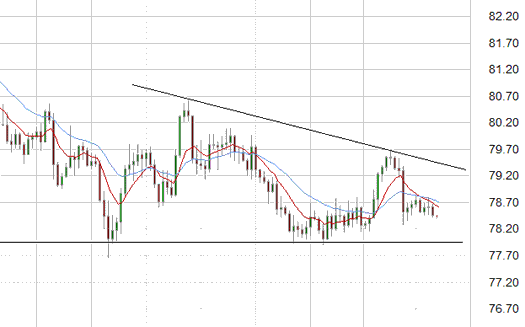
The last six months or so have seen the USD/JPY slowly declining from its March highs around 84.  In the last few months it has been forming a descending triangle with a solid support level around the 78 level. Throughout the last month, this has consistently supported the Yen and temporarily halted its steady decline. During this descending triangle, the peaks have become lower as sellers are enthusiastic to sell at lower prices than previously placing downward pressure on the Yen.   (Daily chart below)

USD / JPY |
Aug 31 at 06:45 GMT |
| 78.45/46 | Â Â H: 78.66 | Â Â L: 78.43 |
| S3 | S2 | S1 | R1 | R2 | R3 |
| 78.00 | 76.00 | — | 80.00 | 82.00 | — |
USD/JPY Technical
- During the hours of the Asian trading session on Friday, the USD/JPY has been continuing its steady decline pushing down towards 78.
- Short term, the 78.50 level has been offering some support and the 78.00 is likely to offer support over the medium term having previously been a strong support level for the last month.
- Current range: Maintaining above 78.00. Will the Yen break down from its descending triangle?
Further levels in both directions:
- Below: 78.00, and 76.00.
- Above: 80.00, and 82.00.
- Should the USD/JPY be able to break down through the support level around 78, then a return back to the congestion level at 76 is possible.
August 31
- AU 1:30 (GMT) Private Sector Credit (Jul)
- JP 5:00 (GMT) JP Housing starts (Jul)
- US 13:55 (GMT) US Univ of Mich Sent. (Final) (Aug)
- US 14:00 (GMT) US Factory Orders (Jul)
Content is for general information purposes only. It is not investment advice or a solution to buy or sell securities. Opinions are the authors; not necessarily that of OANDA Business Information & Services, Inc. or any of its affiliates, subsidiaries, officers or directors. If you would like to reproduce or redistribute any of the content found on MarketPulse, an award winning forex, commodities and global indices analysis and news site service produced by OANDA Business Information & Services, Inc., please access the RSS feed or contact us at info@marketpulse.com. Visit https://www.marketpulse.com/ to find out more about the beat of the global markets. © 2023 OANDA Business Information & Services Inc.

