David Munro, Consulting Market Strategist for OANDA Asia Pacific
The crash of 2008 pushed implied volatility, the market’s reflection of risk, uncertainty and fear, to levels previously unimagined. One-year currency volatility jumped to 20% in the majors, double the traditional 10% level and it soared as high as 40% in the emerging currencies. One-year equity implied volatility hit 50% in both the Euro Stoxx 50 Index and the S&P 500 index and vaulted even higher to 60% in Japan’s Nikkei 225 and Korea’s Kospi 200. Western market volatility rose to the rafters and Asian volatility went through the roof. But was the market’s extreme rating of volatility really based on their fear of the unknown, or is it possible the high volatility was merely a reflection of what they already knew?
The market, through implied volatility, places a value on the past daemons they know, not the phantoms of the future. Think about it: volatility peaks when terrible news is displayed on the front page of the FT and troughs shortly after a Federal Reserve Governor (with closely-cropped white beard) announces the arrival of “The Great Moderation†and proclaims the demise of macroeconomic volatility. The dot-com crash led to a 2002 volatility peak, which was followed four years later by a volatility bottom. The 2007/8 credit-mortgage-leverage debacle culminated with a volatility peak and four years later we are rapidly falling towards a volatility bottom.
Low Volatility Precedes a Trend
Low volatility does not always presage a calamity in equities or punishment for a mismanaged currency. It merely increases the probability that a trend will develop. Many long-term stock market, commodity and currency trends – up and down – have started from cyclically low implied volatility. From a low volatility base, a rising equity trend will push volatility marginally higher, while a stock downtrend will usually lead to extremely high volatility readings. The Hang Seng index is a good case in point; during cyclic market advances, implied volatility is at its lowest when the Index is approximately two-thirds of the way to the top. During cyclic market downtrends, implied volatility bases when the market forms a countertrend peak.
An unhedged market is the most enduring characteristic of a low volatility environment. Any recent hedges will have lost you money due to falling volatility and the lack of a trend. Chances are you will have lost your entire premium and your boss/investors will be questioning your sanity (and long-term employment prospects) for having purchased such useless insurance. So people stop hedging. Long volatility hedge funds go out of business. When investors feel most confident, they increase risk and become leveraged beta hunters. When fear dominates the landscape, the market goes to cash. Both scenarios set the stage for the beginning of a potentially lengthy trend.
Long-term currency and equity volatility and skew have plummeted in the past couple of weeks. We think there may be a bit more room on the downside but – to paraphrase an oft-repeated doomsday prophesy – the end [of low volatility] is near.
Nix on the VIX
The VIX is the standard-bearer for volatility, but its short one month tenure makes it way too much of a chaotic measure to be considered for any serious long-term volatility analysis. Technically, it is a one-month forward-starting variance contract and its path bears a closer resemblance to the pattern a blindfolded toddler on a sugar rush would create with an Etch-a-Sketch than the measured uncertainty of a rational investor.
Consequently, we focus on the significantly more stable and trending one-year implied volatility measure in our attempts to divine the cyclic nature of human fear, greed, memory, forgetfulness and the polarity between the lax regulation that accompanies leveraged exuberance and the overregulation and deleveraging that accompanies the bunker mentality of economic malaise.
Twenty Years ago, Sterling Took a Pounding
In late 1992, the British Pound plunged from 2.0000 to 1.4000 and one-year implied volatility rose to 14.2%. The pain inflicted on foreign companies with Sterling revenue and on UK importers was immense.
I recall an esteemed Canadian institution that had been selling GBP/USD call options against their Pound Sterling revenue for many years (as an options trader at a bank, I made prices for them). The company predated the confederation of Canada in 1867 and there were few over the age of 18 who had not sampled their inhibition-reducing product. The buy/write strategy (long GBP revenue/short GBP calls) was an ideal way to capture continuing Pound strength and mitigate downside risk via the option premium. The Board of the Company ordered a review of the strategy in 1992 and found that selling GBP puts instead of calls would have resulted in even greater profitability. So the board changed the strategy, the company began selling GBP puts and went bankrupt within a couple of weeks of George Soros’ assault on the Pound.
The boards of many other companies who had suffered from the collapse of the Pound planned for a second lightning strike and ordered their risk managers to implement hedging strategies. The risk managers purchased overvalued options, the Pound went nowhere, implied volatility fell for four years, the hedging strategies produced nothing but red ink and the boards, having lost their appetite for useless insurance, cancelled the hedging strategies. The stage was then set for a trend.
There are two morals to this story. 1) After implied volatility spikes to an extreme high, risk tolerance disappears and positions are either cut or hedged. When volatility is low, positions tend to be small and unhedged. 2) Never let your board trade derivatives.
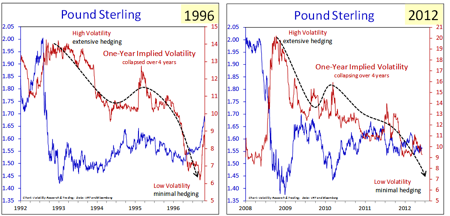
The eerie similarities between the 1992 and 2008 Sterling swan dives (both from 2.00 down to 1.40), the sideways consolidations over the subsequent four years (a 1.45 to 1.65 range), and the corresponding four-year collapse in one-year implied volatility make us acutely aware of what might transpire if Act II continues according to the original script; a final volatility washout to the 6-7% level followed by a 20 to 30 big figure move and rapidly rising volatility. Let’s see how many corporate boards are confident (or far-sighted) enough to hedge long-term exposures when implied volatility hits rock bottom and the Pound looks like it will never move again.
Crisis? What Crisis?
While short-dated currency implied volatility has periodically probed low levels for the past year, long-dated implied volatility has stubbornly remained high. Consider one-month implied volatility a reflection of our collective short-term financial memory and one-year implied volatility a measure of our long-term memory. After four years of constant paranoid hand-wringing over the fate of the US
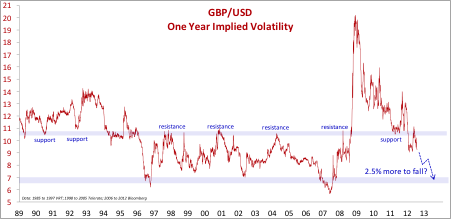
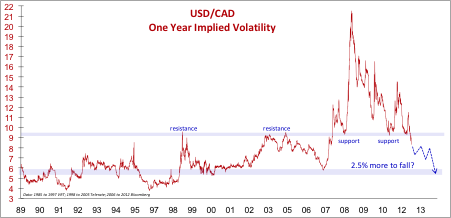
Economy, European debt and Chinese housing, the wall of worry has begun to crumble. Our long-term memory of negative economic events is rapidly fading. One-year implied volatility has dropped through support levels in GBP/USD, AUD/USD and USD/CAD and is threatening to break support in EUR/USD. USD/JPY volatility has been collapsing since the beginning of the year.
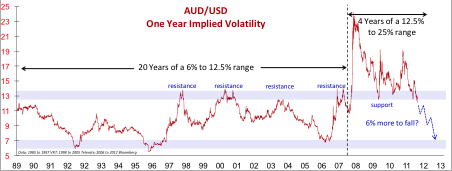
The Australian dollar assumed the role of “most efficient risk-off hedge†when the currency plummeted and volatility soared in late 2008. Equity traders bought Aussie puts or risk reversals (long OTM puts and short OTM calls) to protect their long equity portfolios. Carry traders who funded their Aussie longs with low-interest Yen (and other major currencies with interest rates close to zero) also hedged with AUD puts. But the strategy bombed – the Australian dollar is higher and volatility is lower. Most hedges expired worthless. Since we tend to forget events that are either old (2008) or painful (AUD hedges), the demand for long-dated AUD puts is rapidly disappearing, and the significant 12.5% volatility support level has just been breached. An additional drop of 6% in one-year AUD/USD implied volatility would bring us back the rock-bottom levels that prevailed during the calm economic environments of 1992, 1996 and 2006.
Loonie Volatility Falling to Earth
One-year Canadian Dollar implied volatility just fell through the critical 9% level that repelled rising volatility in 1998, 2003 and 2005 and supported falling volatility in early 2008 and 2011. A further 2.5% drop in volatility would complete a return to the lowest levels of the past 13 years. Gold and crude oil implied volatilities are also falling, but remain well above their historic base levels. The commodity complex (ex-agricultural) and the currencies that represent them are hinting at calmer days ahead.
Japan – The Calm After the Storm
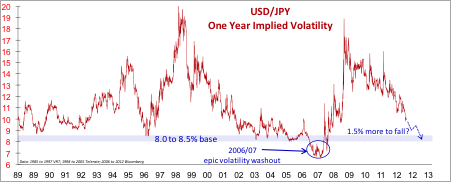
In the old days, when Japan had a trade surplus, the Yen strengthened and USD/JPY puts were in demand. Oddly enough, now that Japan has a trade deficit, the Yen continues to strengthen but USD/JPY puts are avoided like the plague. USD/JPY spot and implied volatility, breaking years of negatively correlated tradition, fall together. One-year implied volatility first broke down through the 12% level as 2012 was ushered in, and it has followed through with a collapse to 10%. To reach the long-term base of 8.0 to 8.5%, one-year implied volatility must fall an additional 1.5%, which is not very much in the grand scheme of things. If that were to happen, the oft-predicted rise in USD/JPY might have a greater probability of success.
EURO – Memory Overload
The EURO, mighty mistake of epic proportions, is the lone volatility holdout. As much as the world wants the paralyzing polarity of perplexed pan-European politicians to evaporate and make way for a lasting solution to peripheral pandemonium, it’s not happening. So hedges remain in place and one-year implied volatility hovers just above important 11% long-term support. Faded memories of 2008 have been replaced by constant reminders of gridlocked governance.
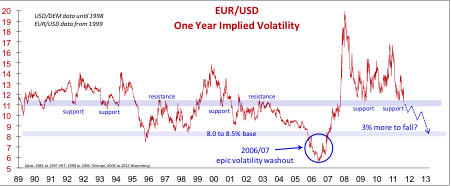
Nevertheless, EUR/USD one-year implied volatility is sitting on a precipice and all that is required to send it earthbound is a gentle nudge. What set of circumstances could possibly allow the marketplace to relax and stop hedging EURO exposures? Perhaps battle fatigue will play a role. Might Merkel, Draghi and Holland start to harmonize? Maybe economic activity will fall to such depths that there will be no more international trade to hedge. Whatever the reason, all memories eventually fade. Keep your eye on a break of the 11% one-year implied volatility level for a sign of calmer seas ahead. And then hoist the sails for the ride of your life when lucky 8% looms on the horizon.
Sources:
- Etch-a-Sketch picture (edited): http://sandbox.yoyogames.com/extras/image/name/san2/746/262746/etch-a-sketch-blank.jpg
- Federal Reserve Governor Ben S. Bernanke (now Fed Chairman) gave a speech titled “The Great Moderation†on 20 February, 2004 at the Eastern Economic Association in Washington DC. http://www.federalreserve.gov/BOARDDOCS/SPEECHES/2004/20040220/default.htm
- Implied Volatility Data: 1985 to 1997 the author, 1998 to 2005 Telerate, 2006 to 2012 Bloomberg
.
Disclaimer
Any opinion in this material may not necessarily represent the opinion of OANDA or any entity in the OANDA Group. OANDA makes no representation or warranty of any kind, express, implied or statutory regarding this material or any information contained or referred to in this material. The material is provided for information purposes only. It does not constitute any offer, recommendation or solicitation to any person to enter into any transaction or adopt any hedging, trading or investment strategy, nor does it constitute any prediction of likely future movements in rates or prices or any representation that any such future movements will not exceed those shown in any illustration. Past performance is not indicative of comparable future results and no representation or warranty is made regarding future performance.
OANDA accepts no liability and will not be liable for any loss or damage arising directly or indirectly (including special, incidental or consequential loss or damage) from your receipt of this material, howsoever arising, and including any loss, damage or expense arising from, but not limited to, any defect, error, imperfection, fault, mistake or inaccuracy with this material, its contents or associated services, or due to any unavailability of the material or any part thereof or any contents or associated services. The information presented in this material has been obtained from sources we believe to be reliable but we do not make any representation or warranty nor accept any responsibility or liability as to its accuracy, completeness or correctness. Opinions and views expressed in the material are subject to change without notice. Copyright: OANDA Asia Pacific Pte Ltd 2012. Copyright in all materials, text, articles and information presented in this set of material is the property of, and may only be reproduced with permission of an authorised signatory of OANDA Asia Pacific Pte Ltd.
Copyright in materials created by third parties and the rights under copyright of such parties is hereby acknowledged. Copyright in all other materials not belonging to third parties and copyright in these materials as a compilation vests with and shall remain at all times copyright of OANDA Asia Pacific Pte Ltd and should not be reproduced or used except for business purposes on behalf of OANDA Asia Pacific Pte Ltd or save with the express prior written consent of an authorised signatory of OANDA Asia Pacific Pte Ltd. All rights reserved. © OANDA Asia Pacific Pte Ltd 2012. OANDA’s Terms of Use and Privacy Policy apply. Trading in the leveraged over-the-counter market carries a high level of risk and may not be suitable for all investors. You should never put at risk, any amount that you cannot afford to lose. More details under: http://www.oanda.sg/risk-disclosure.shtml
Content is for general information purposes only. It is not investment advice or a solution to buy or sell securities. Opinions are the authors; not necessarily that of OANDA Business Information & Services, Inc. or any of its affiliates, subsidiaries, officers or directors. If you would like to reproduce or redistribute any of the content found on MarketPulse, an award winning forex, commodities and global indices analysis and news site service produced by OANDA Business Information & Services, Inc., please access the RSS feed or contact us at info@marketpulse.com. Visit https://www.marketpulse.com/ to find out more about the beat of the global markets. © 2023 OANDA Business Information & Services Inc.
Latest posts by marketpulsefxstaff (see all)
- Oil Remains Near Multi-Month Lows - 6 August 2015
- U.S. Dollar Higher on Recent Data - 6 August 2015
- Greece’s PM Tsipras: Loan Deal with Lenders Close - 6 August 2015