Asian and European equity indices are lower on yet more alleged U.S. political concerns, but this may not be the real story.
Another day another potential scandal coming out of Washington D.C. This time the President has allegedly spilt intelligence to the Russians and has Trumptation’ed allegedly, the now ex FBI Director into dropping their investigation of ex-National Security Advisor Flynn’s ties with Russia. The street has blamed “alleged fatigue” on the fall of the U.S. Dollar which is slightly unfair to Mr.Trump.
I would agree the constant train of gaffs is eroding his support in Congress and making it ever harder to enact his legislative agenda including tax reform. The real reason for the U.S. Dollars demise and the weakening of equities from near record highs the day before is much simpler. Most U.S. data of late has consistently come in below expectations, including yesterday’s Housing Starts numbers. This is mollifying expectations on the Federal Reserve rate hike front, and with European data, in particular, coming in consistently stronger, U.S yields have been dropping, and the yield spread differentials have closed up.
Secondly, oil prices were crushed last night on higher than expected API Crude Inventories undoing much of the OPEC-led “forward guidance” rhetoric of the last few days. Combined with breathtaking levels in most equity indices it probably wouldn’t have taken a lot to see traders rush to take some risk of the board and flip into other G-10 currencies and gold.
Following the sell-off in the S and P mini in early Asia, regional bourses have followed suite with Europe likely to do so initally as well.
S&P 500
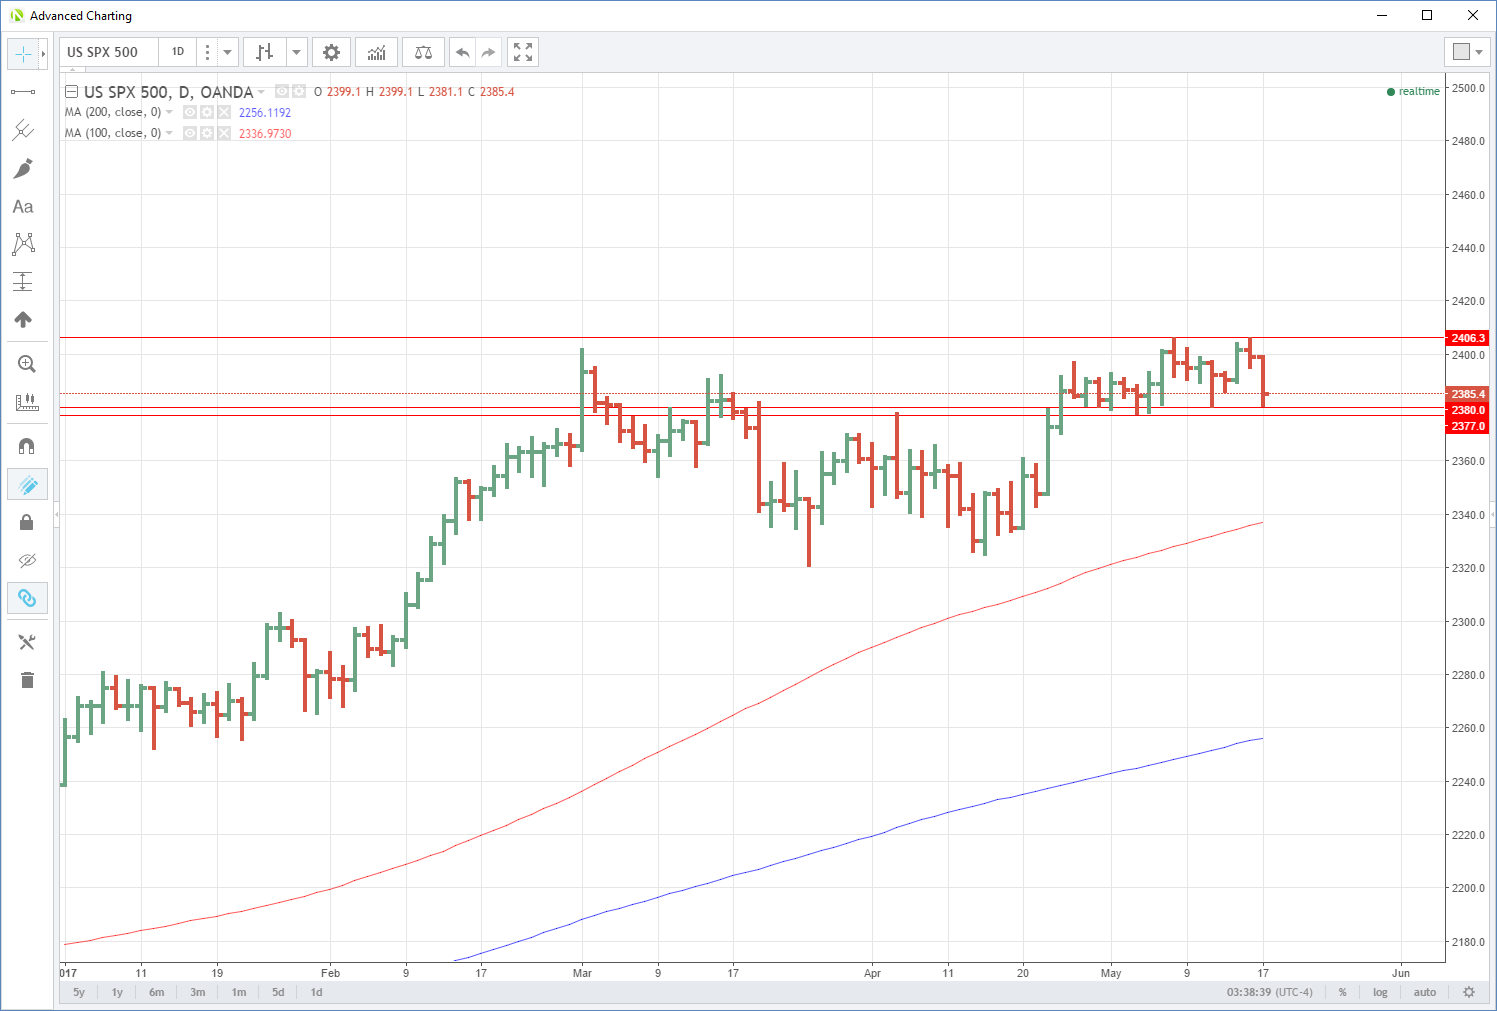
The S&P has now formed a double top on the daily charts at 2406 with a total of five failures in the 2400/2406 area. In the near term this all time high will form fairly solid short-term resistance against a backdrop of political uncertainty in the U.S,
The index hovers just above a triple bottom at 2380 and then a double bottom at 2377. From a technical perspective, a close below the latter could open up a correction to the 100-day moving average sitting in the 2337 region.
S&P Daily
ASX 200
The resource-heavy ASX has followed the lead of the S&P today, helped along by lower oil prices. The index closing down 0.8% for the session. It seems to be open hunting season for the large domestic banks in Australia at the moment as well with calls for an enquiry into their lending rate setting processes following on from the “levy” they received in the recent Federal budget. The four majors have a very large weighting in the ASX and could continue to provide headwinds for the index, in general, going forward.
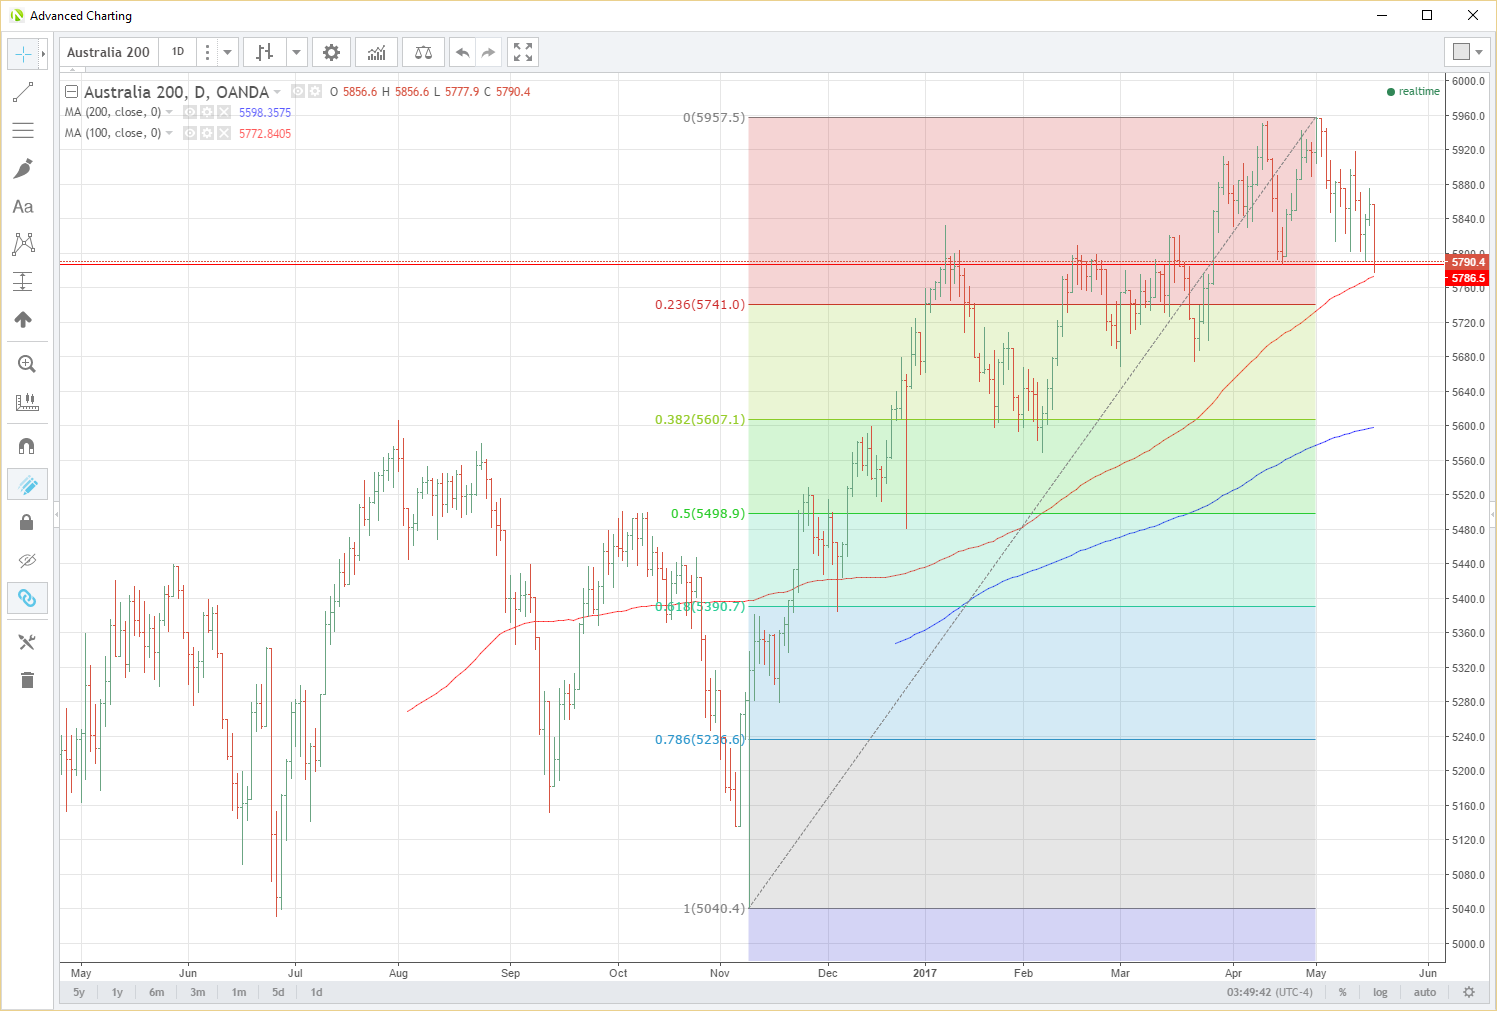
The ASX closed near its lows at 5787 which is right on the double bottom support level on the daily chart and just above the 100-day moving average at 5773, which it just avoided closing below. A break here could open up a move to the 23.6% Fibonacci retracement at 5741. Beyond this, the next support appears in the 5670 area.
Resistance is at today’s open at 5857 followed by 5920 and 5960.
ASX Daily
Nikkei 225
Another to finish precariously perched above support. The Nikkei has followed USD/JPY lower over the course of the day to finish 0.60% down as a stronger Yen leads to the selling of exporter facing sectors in the index.
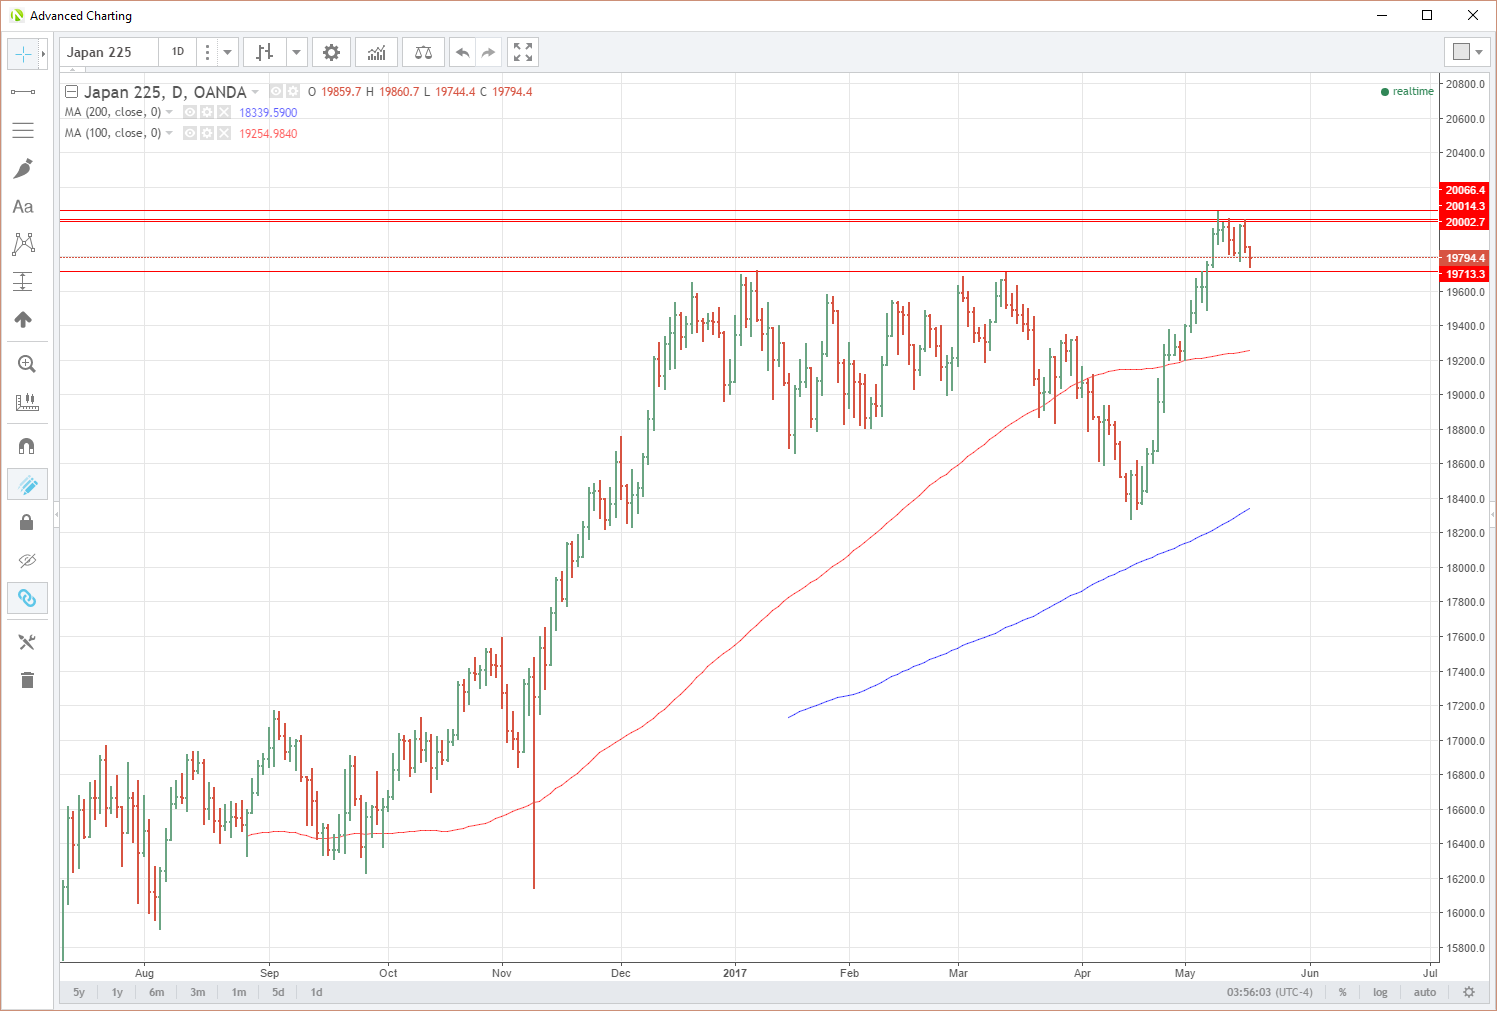
The Nikkei is floating just above the short term pivot level of 19,713, a previous triple top. A close below heard could set the tone for a move lower to the area of the 100-day moving average at 19,255.
Resistance is stacked above at the psychological 20,000 level with the 9th May high at 20,014 just behind.
Nikkei 225 Daily
DAX 30
The German Dax 30 is the darling of global stock markets at the moment. The primary beneficiary of much improved European data and a heavy rotation of money from the U.S. Dollar into the Euro. It would be a brave man to pick the top in the DAX in the medium term looking at the daily chart. However in the short term at least, following on from the U.S. overnight the technical picture is a little more cloudy.
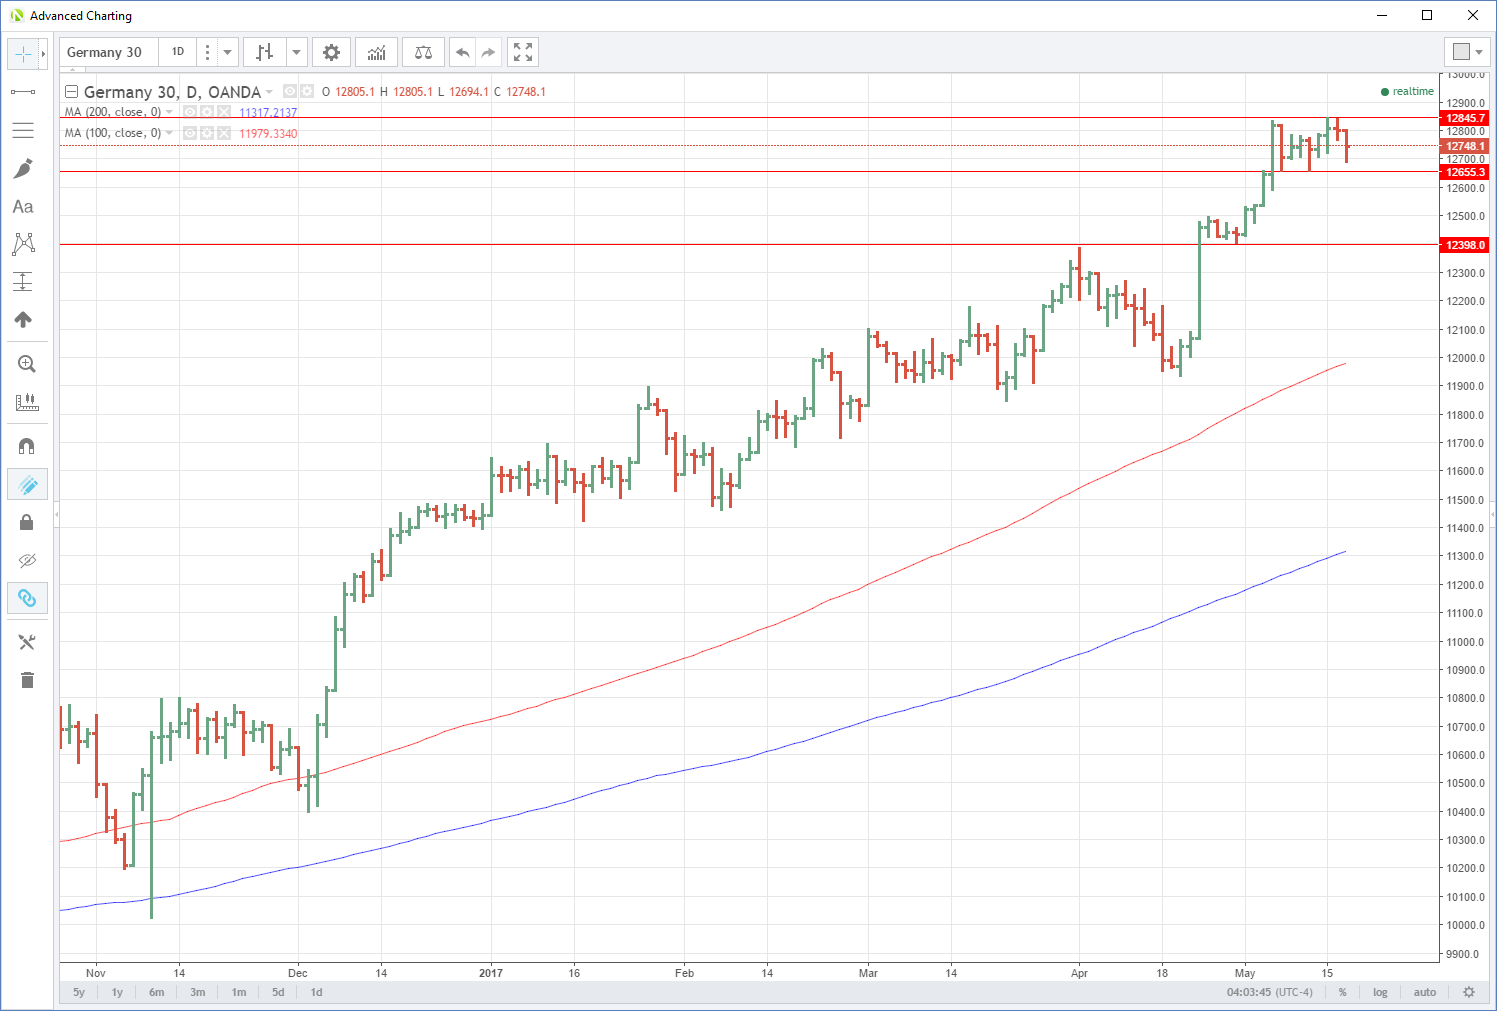
We have a triple top in place now around the all-time high of 12,845 which may prove a tough nut to crack in the near term.
Support rests at the nearby double bottom at 12,655 with a daily close below implying a possible move to the 12,400 regions.
DAX Daily
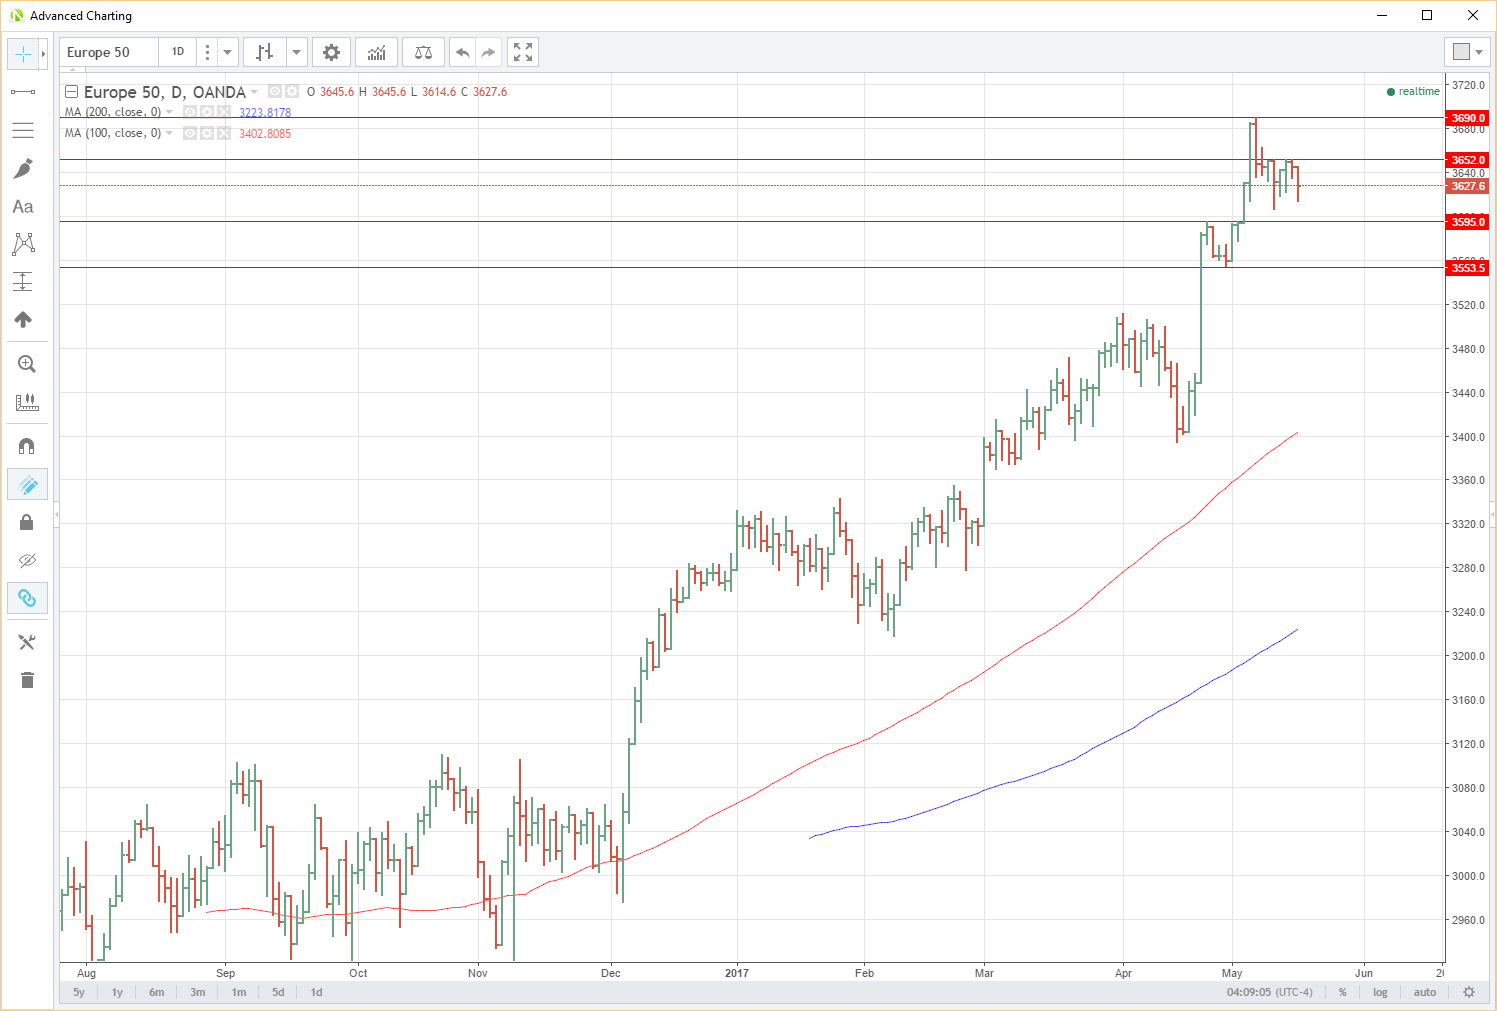
Euro Stoxx 50
Another index that only a brave man would try to pick the absolute highs on in the medium term based on the charts. However, it to had a rather more clouded short term picture.
Resistance lies above at 3652 which has multiple failures in the last week. Above here, the 18-month high at 3690 provides another level of resistance.
Support lurks just below at 3595 followed by the March low at 3553. A close below the latter could imply a deeper correction is on the cards.
Euro Stoxx 50 Daily
Summary
Whilst the latest temptations of Trump episode is blamed for today’s U.S. Dollar weakness and the sell-off in the major stock indices, this may be a case of fitting the latest news to the price action. Consistently weaker U.S. data, falling U.S. yields and a narrowing of the rate differentials is far more likely to be the underlying cause.
Admittedly the constant stream of “news” from Washington D.C. and its longer term effect on enacting economic policy will no doubt hurt sentiment. However, from a purely technical perspective, the real reason may be as simple as most major indices forming short-term topping patterns anyway over the last week meaning traders don’t need a lot of excuses to head for the exit door with stocks at such elevated levels.
Content is for general information purposes only. It is not investment advice or a solution to buy or sell securities. Opinions are the authors; not necessarily that of OANDA Business Information & Services, Inc. or any of its affiliates, subsidiaries, officers or directors. If you would like to reproduce or redistribute any of the content found on MarketPulse, an award winning forex, commodities and global indices analysis and news site service produced by OANDA Business Information & Services, Inc., please access the RSS feed or contact us at info@marketpulse.com. Visit https://www.marketpulse.com/ to find out more about the beat of the global markets. © 2023 OANDA Business Information & Services Inc.
Jeffrey Halley
Latest posts by Jeffrey Halley (see all)
- Oil slides, gold rally continues - 5 August 2022
- US dollar retreat continues - 5 August 2022
- Pelosi relief rally in Asia - 5 August 2022