Gold has failed yet again at resistance in the $1220 region and has broken its up channel.
Perhaps the key words here are “yet again” with regards to Gold. As the chart below shows, Gold has tested and failed at the 1219/1220 area not once but four times in January. Behind this lurks another region of strong resistance. A series of daily highs from November around 1234 which is also the 100-day moving average.
In the short term, the 1200 level will provide some psychological support with a previous daily low at 1295.50 the last near term line of support.
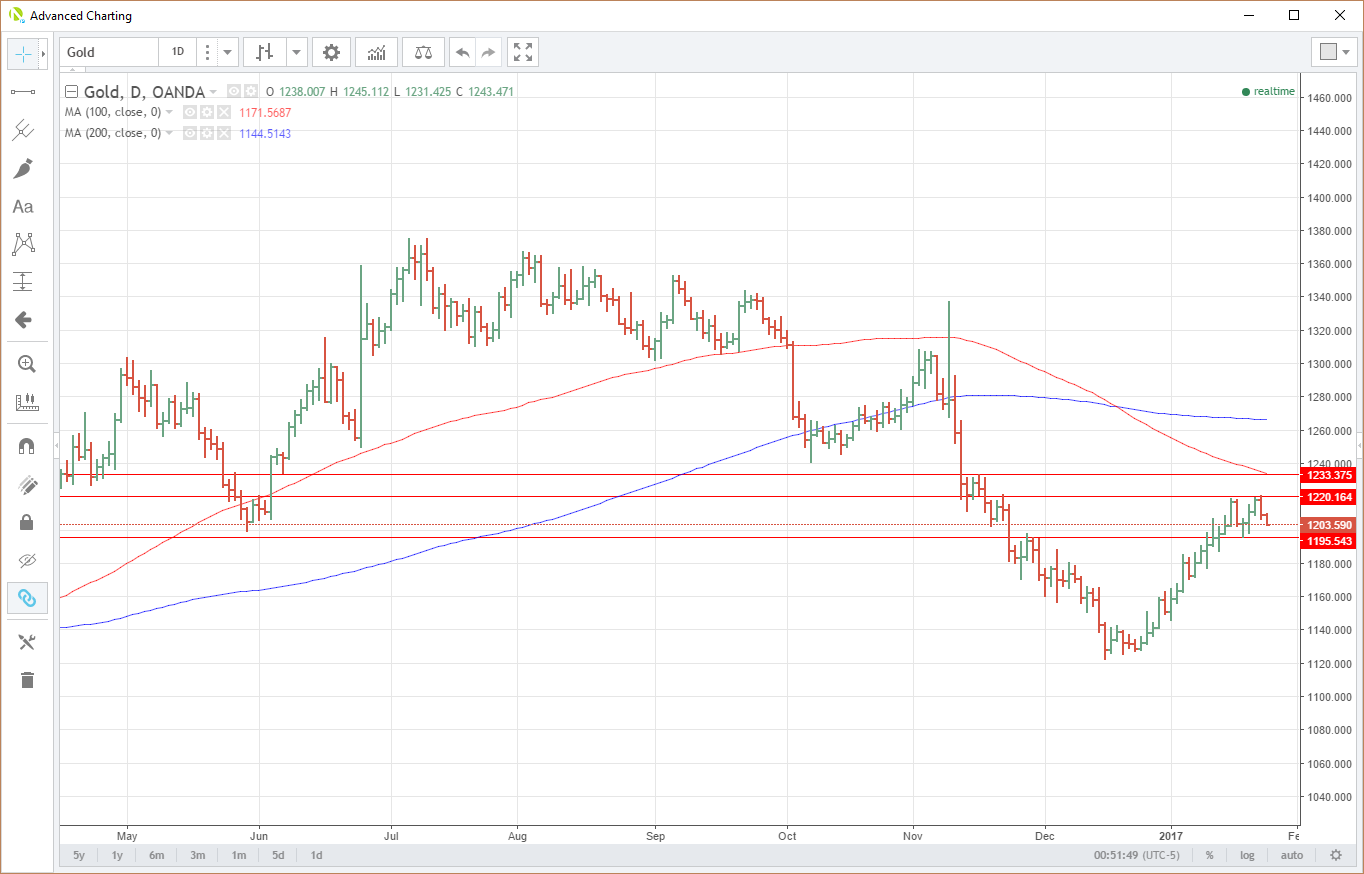
Gold Daily
Much noise has been made in the press of late about Gold as a hedge against uncertainty and with this, I would agree to a certain extent. We are most certainly living in uncertain times and I suspect this safe haven premium has been a large part of Golds ascent above 1200.
Looking at the daily chart another way we can see Gold broke out of its up-channel from the beginning of January on the 17th of January. It has then made multiple attempts to regain the channel and failed. Today the base of the channel is at 1227.50 so from a technical perspective the breakout is still valid up to that level.
The breakout should be respected because as the chart highlights, the breakout from Decembers downwards channel resulted in a 100% retracement of the entire move. This should make bulls more nervous than a Mexican trade negotiator but Gold is not showing strong momentum either way for now. As Mr Trump stampedes his way through his first week in office, the risk premium supporting Gold is for now offsetting the technical signals.
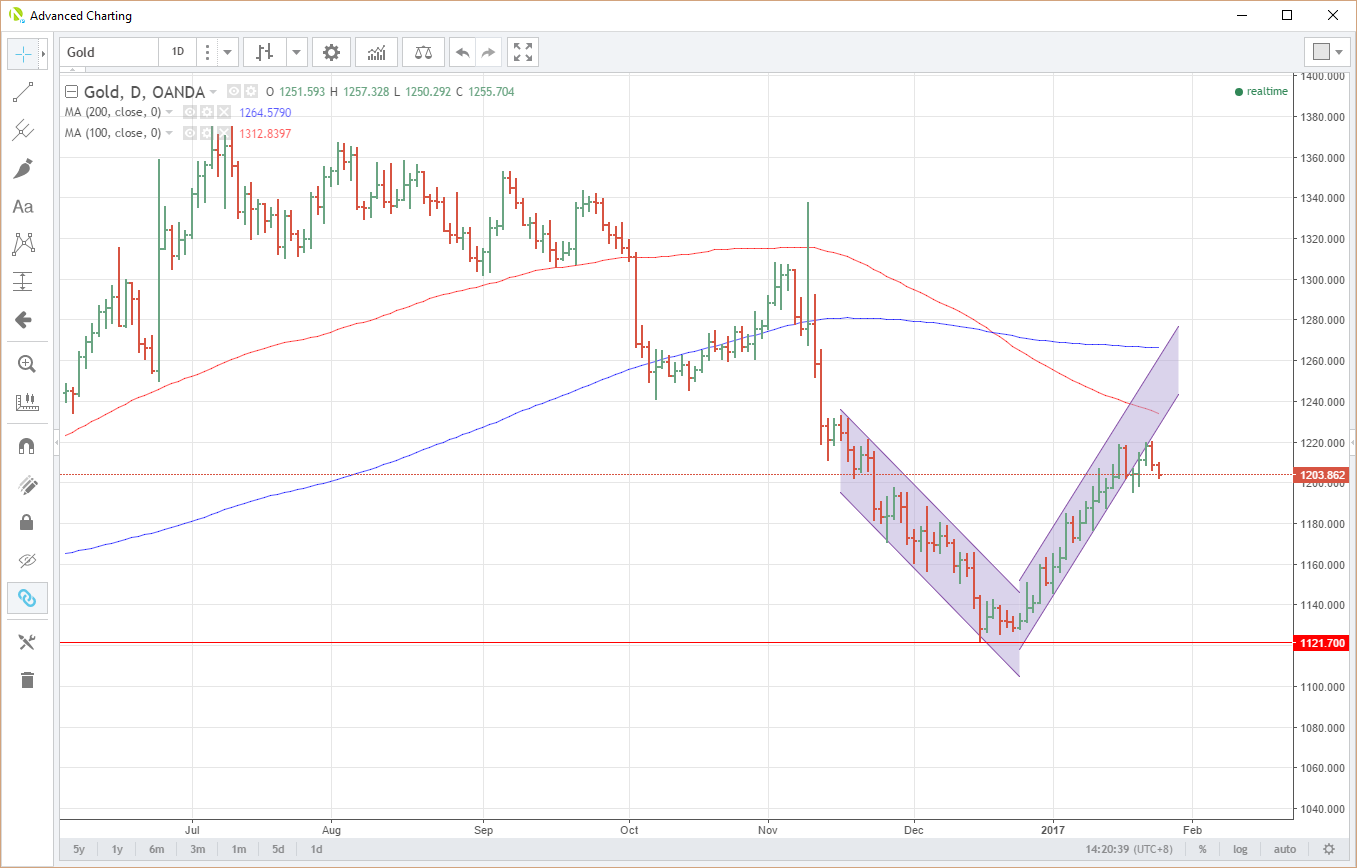
Gold Daily with channels.
The US economy seems to be firing on all cylinders at the moment as well. Certainly the data supports this from overnight.
– (US) JAN PRELIMINARY MARKIT MANUFACTURING PMI: 55.1 V 54.5E (highest since March 2015); new orders rise m/m to highest since Sep 2014
– (US) DEC EXISTING HOME SALES: 5.49M V 5.51ME; supply shrinks to 3.6 months
– (US) JAN RICHMOND FED MANUFACTURING INDEX: 12 V 7E; Volume of new orders 15 v 11 prior
– (US) Jan Philadelphia Fed Non-Manufacturing General Business Conditions 37.7 v 19.5 m/m; New orders 28.9 v 20.2 m/m
source: Trade the News
To put this data in perspective, the housing supply at 3.6 months is at its lowest level since September 1999. the Richmond Fed Manf. Index number marked a 3rd consecutive rise of this closely followed data point. The data thus far then implies that the Federal Reserves three hike dot plot remains on track,without even adjusting for a Trump on a Caligula-like reflation deficit spending binge.
So what does this possibly mean for Gold? Logically US rates must move higher in 2017, perhaps at a higher pace then many expect given the above. As yields increase the appeal of Gold as a non yielding asset will diminish. This may put downward pressure on the yellow metal as 2017 develops.
Having said that, one cannot discount entirely,the chances of some geopolitical event(s) seeing the safe haven premium attached to Gold returning with a force. The technical may paint one picture, politics and Trump-onomics may yet tell another.
Content is for general information purposes only. It is not investment advice or a solution to buy or sell securities. Opinions are the authors; not necessarily that of OANDA Business Information & Services, Inc. or any of its affiliates, subsidiaries, officers or directors. If you would like to reproduce or redistribute any of the content found on MarketPulse, an award winning forex, commodities and global indices analysis and news site service produced by OANDA Business Information & Services, Inc., please access the RSS feed or contact us at info@marketpulse.com. Visit https://www.marketpulse.com/ to find out more about the beat of the global markets. © 2023 OANDA Business Information & Services Inc.
Jeffrey Halley
Latest posts by Jeffrey Halley (see all)
- Oil slides, gold rally continues - 5 August 2022
- US dollar retreat continues - 5 August 2022
- Pelosi relief rally in Asia - 5 August 2022