The Australian dollar has traded within a descending channel against the greenback for more than a year now but in the last couple of days it appears to have finally broken above it, which could be a very bullish signal.
The pair broke above the channel on Friday and despite seeing immediate downside pressure on Monday, ended the day back above, which could act as confirmation of the break. It is also trading back in the green today.

The 100-day simple moving average has also been broken in the process, having provided resistance on a number of occasions over the last six months.
While all of this may be the case, I am not yet convinced by the break. For a start, the reaction in the pair to what should be such a bullish move has been mild at best. I would expect a legitimate break of such a long-term trend to be much more aggressive.
Following yesterday’s retracement, the pair has once again failed to rally with any significant momentum whatsoever. In fact, it is still to break above Monday’s highs. Not exactly a bullish signal.
Fundamentally speaking, we’re only a few weeks away from the next Fed interest rate decision, when the first hike in almost a decade is expected to be announced (Fed Funds futures currently pricing in a 74% chance). Significant US dollar weakness at this moment therefore seems unlikely unless something fundamentally changes.
None of this means we won’t see a move to the upside of course but I would like to see more evidence that this is what we’re seeing. Initially, a break above Friday’s highs may suggest that some form of correction in the pair is underway.
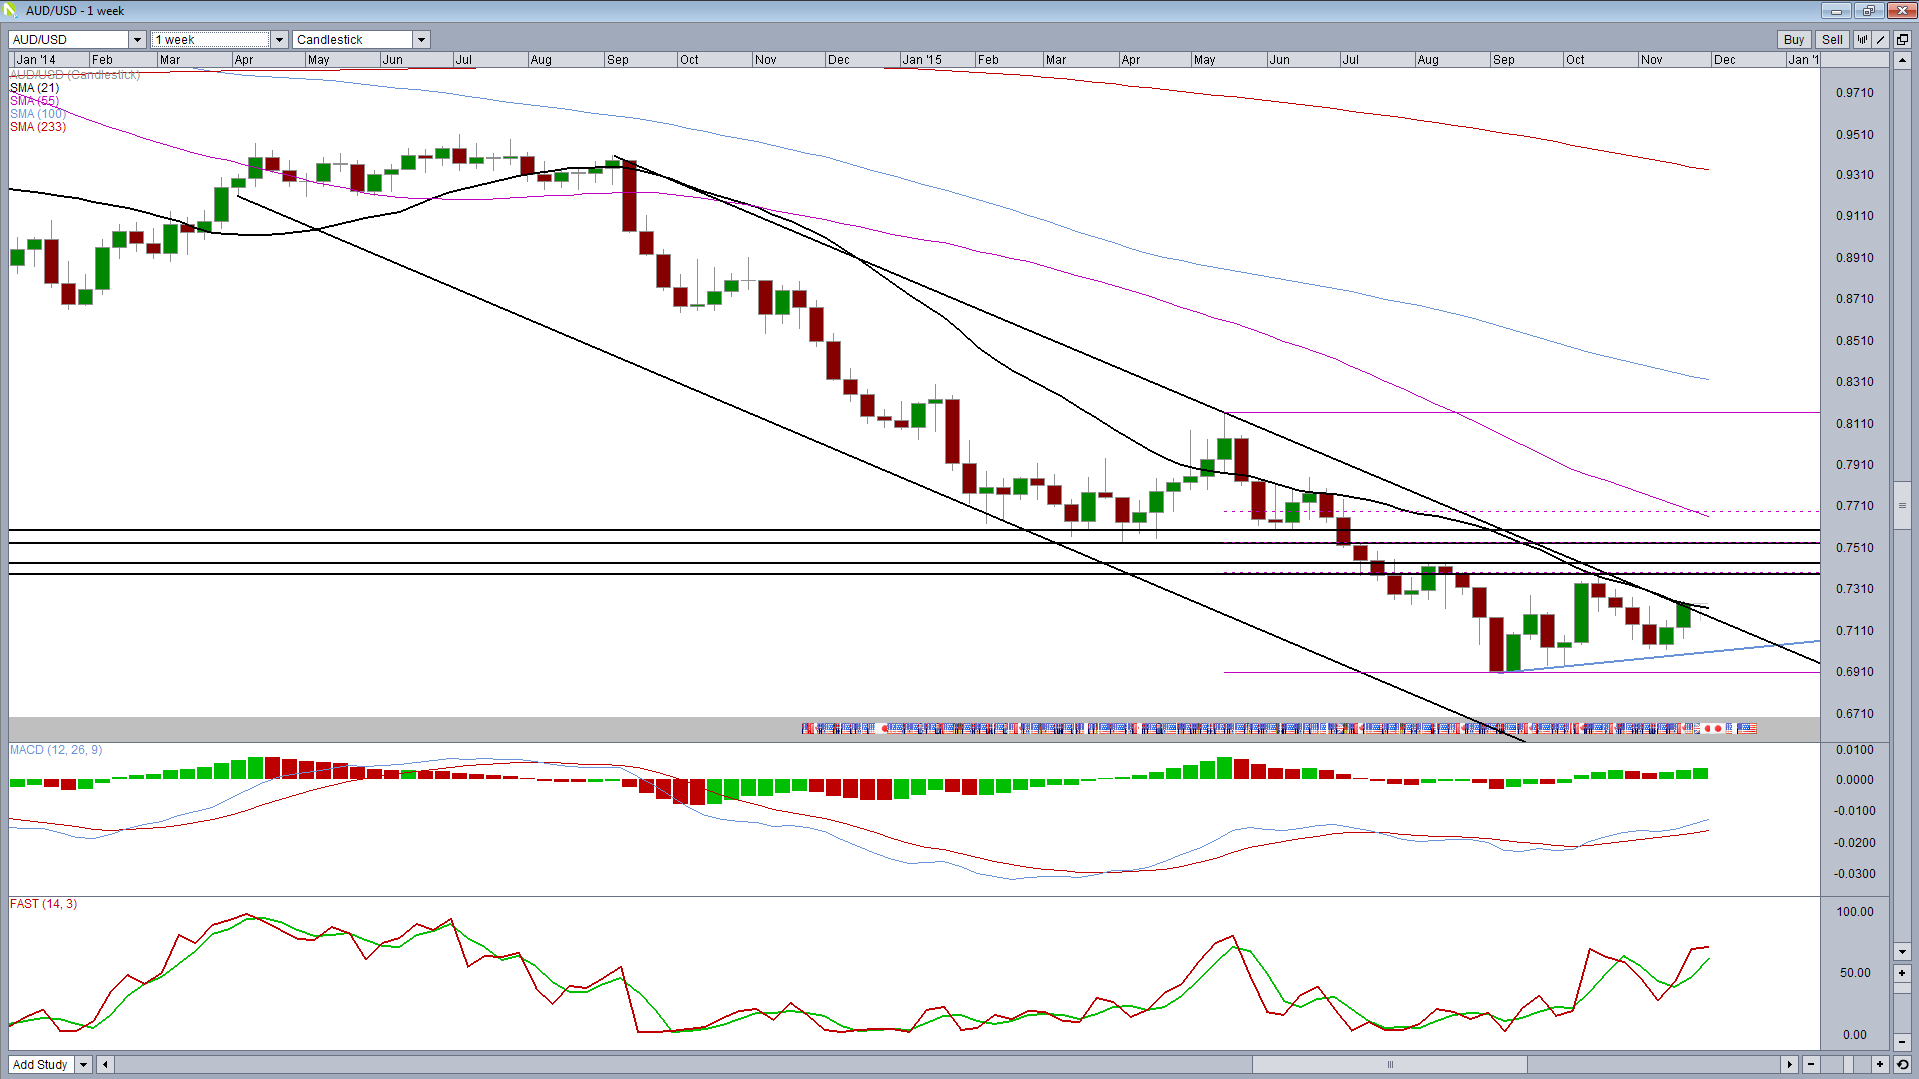
A weekly close above the 21-week SMA would also offer support to this given that it has also been a key level of resistance over the last six months. Back in June we did see a break but the pair failed to close above, as it did again in October. A close above on this occasion would be a bullish signal.
If we do see a move higher, 0.7380-0.7430 could be the next key area of resistance, having been so repeatedly since July. It would also coincide with the 38.2% retracement of the move from 14 May highs to 4 September lows.
Above here, 0.7530-0.76 could be an interesting resistance level having offered strong support between February and June. The 233-day SMA could also offer resistance around here. It would also mark the 50% retracement of the above move.
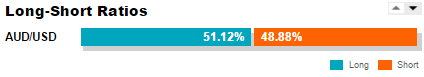 The OANDA Position Ratios tool and many others can be found in the Forex Labs section of the site.
Content is for general information purposes only. It is not investment advice or a solution to buy or sell securities. Opinions are the authors; not necessarily that of OANDA Business Information & Services, Inc. or any of its affiliates, subsidiaries, officers or directors. If you would like to reproduce or redistribute any of the content found on MarketPulse, an award winning forex, commodities and global indices analysis and news site service produced by OANDA Business Information & Services, Inc., please access the RSS feed or contact us at info@marketpulse.com. Visit https://www.marketpulse.com/ to find out more about the beat of the global markets. © 2023 OANDA Business Information & Services Inc.

Former Craig
Latest posts by Former Craig (see all)
- Market Insights Podcast – US GDP, RBNZ holds, bitcoin soars - 28 February 2024
- Market Insights Podcast – Nvidia earnings, record highs for stocks - 23 February 2024
- EUR/USD – A bullish breakout or just further consolidation? - 22 February 2024