Yesterday I wrote a piece on cable and how the rally appears to be running out of steam and that maybe, the dollar is about to see some buying interest following its correction (GBPUSD – Massive Resistance Lies Ahead). Well, the same appears to be happening in EURUSD.
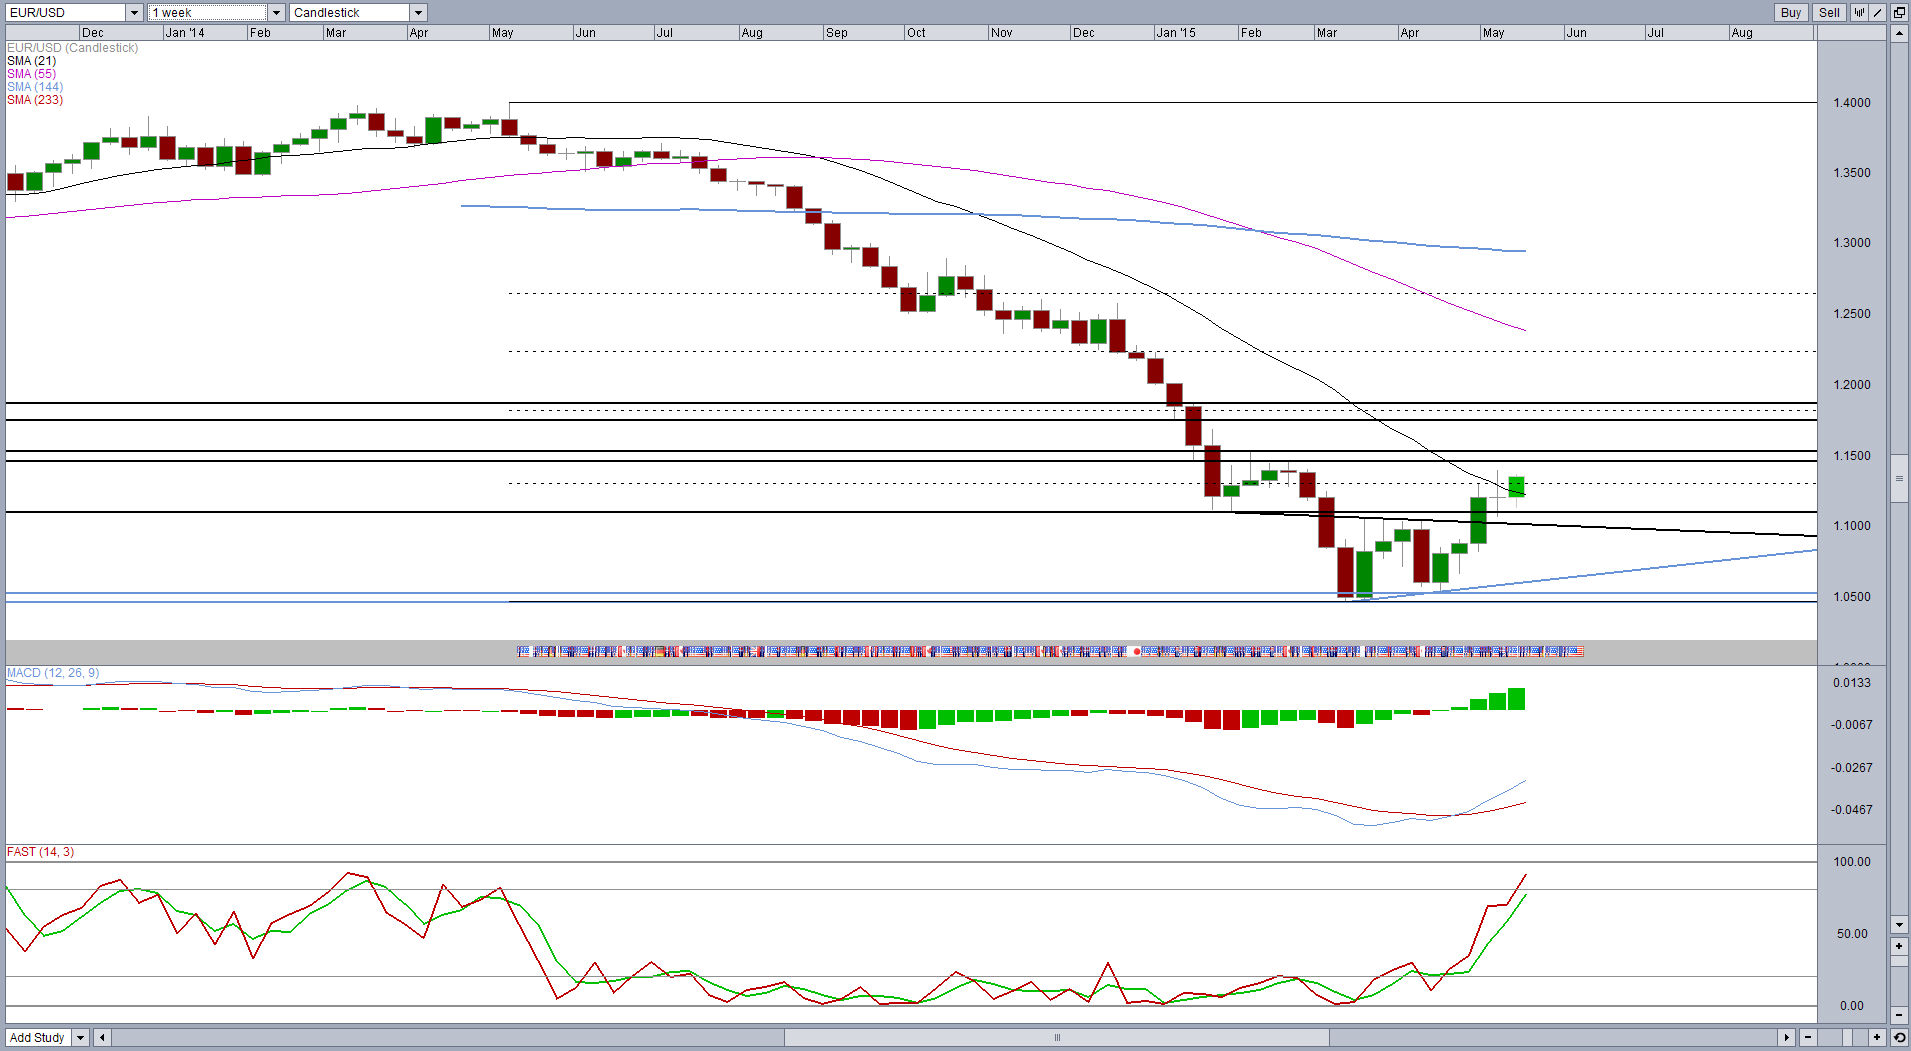
The pair rallied to a new 10 week high last week on slightly lower momentum, as seen by the negative divergences in both the stochastic and MACD histogram. Following a brief pullback, the rally has continued but I’m not convinced that it has the legs to sustain a significant break of last week’s highs, as we saw last week when it made them.
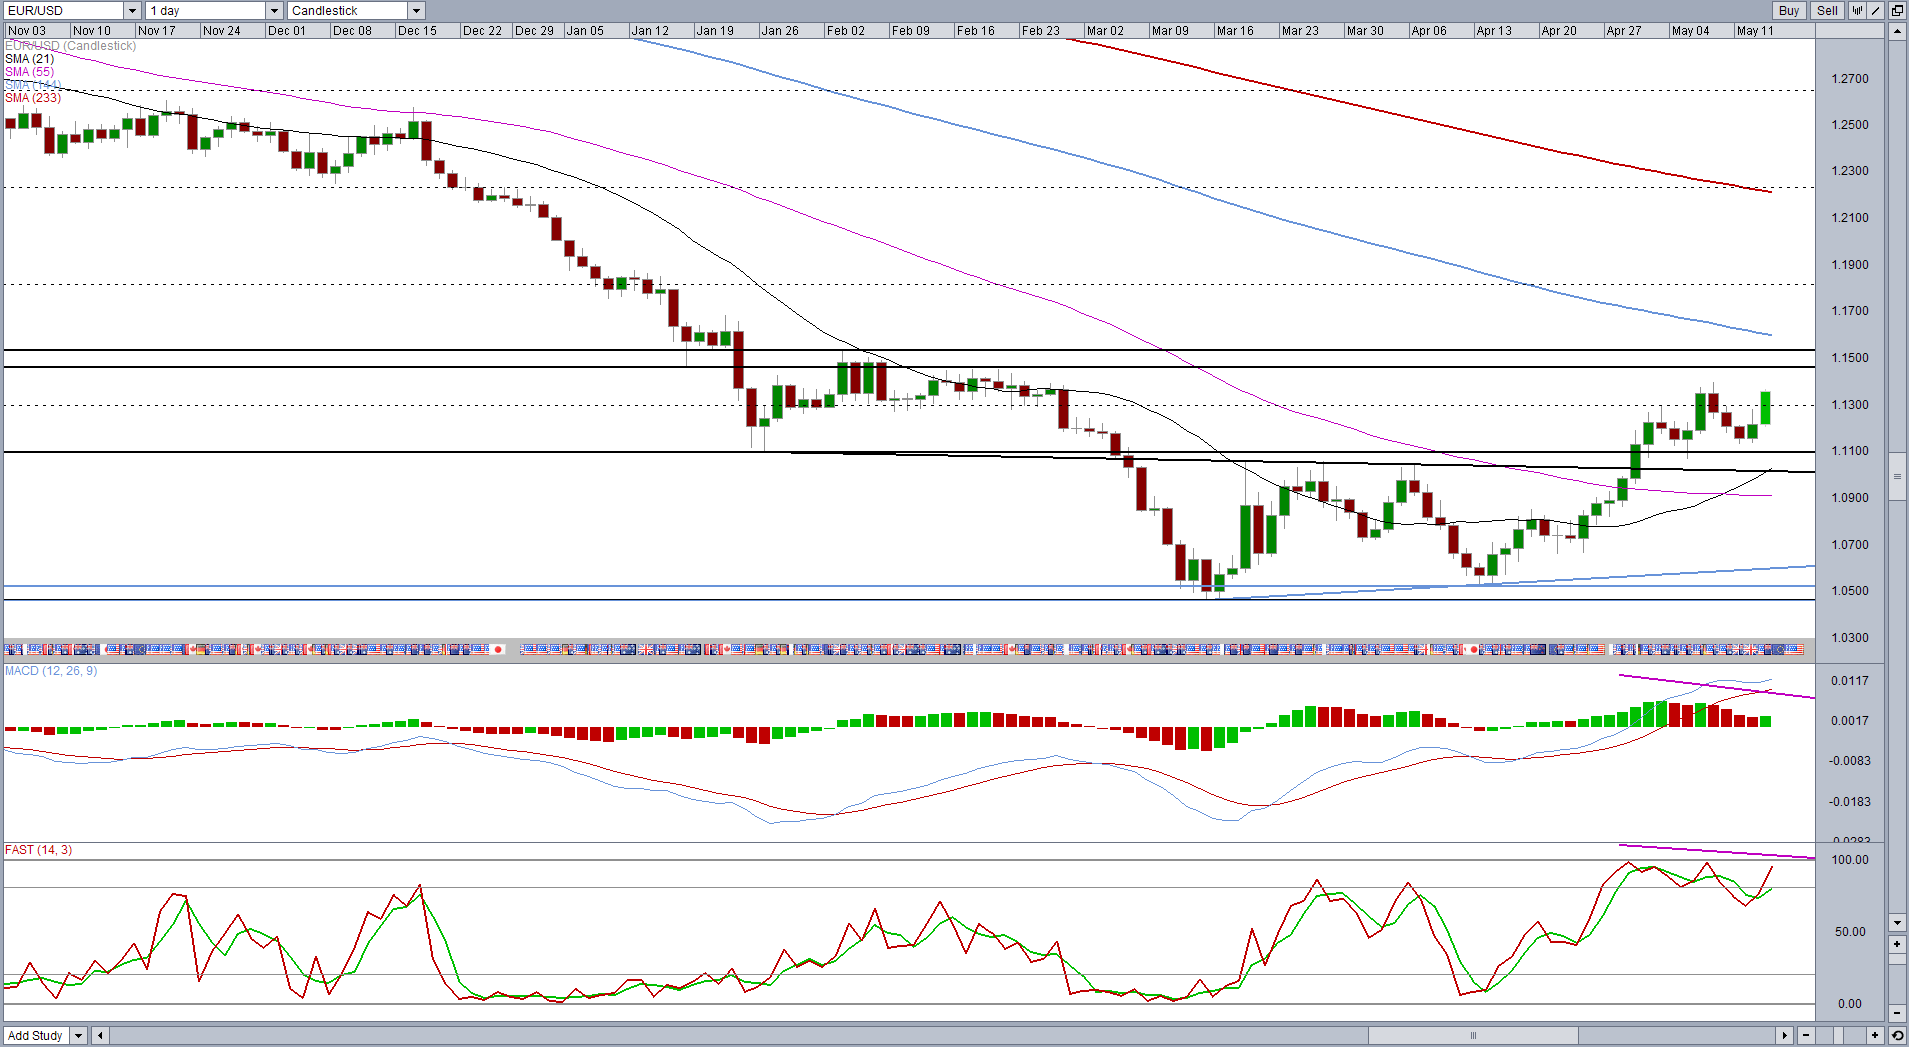
The pair is facing potentially strong resistance not far above last week’s highs between 1.1460 and 1.1535. This was a key area of support and resistance at the start of the year. The 144-day simple moving average could also act as a barrier around these levels as it has on numerous occasions in the past.
The 144 DMA isn’t one of the most common moving averages used by traders but it is a Fibonacci number and, more importantly, it’s been reliable in the past. Many traders look to optimise their MAs for their charts and when it combines with a Fibonacci number, I like it even more.
It should also be noted that the upper end of the above range marks the target level following the break above the neckline of the double bottom which formed between 5 March and 29 April. This is calculated by taking the size of the move from the most recent low on 13 April to the neckline and projecting it above the break. The fact that this move has been completed, along with the factors above, may prompt some profit taking at these levels, adding further resistance.
As Dean stated in his piece earlier this week (German Bund Yields Squeeze EUR Short Positions), the EURUSD rally has been aided by a tightening of the US Treasury – Bund spread. Should we see this start to widen, it may suggest that we’ll see a similar reversal in the fortunes of EURUSD.
Of course, at the moment, this is just a resistance level, there’s no real indication – barring weaker momentum – that this will be broken. I will be looking for clues in price action to support it before I become bearish on the pair. If we see a break above this resistance, the response could be quite aggressive as there could be a large number of stops above here. The next region I would look at if we saw a break is 1.1750 – 1.1875, again a previous cluster of support and resistance and the 38.2% retracement of the sell-off that started last May.
 Source: Forex Open Position Ratios tool in OANDA FX Labs.
 Source: Historical Position Ratios tool in OANDA FX Labs.
Content is for general information purposes only. It is not investment advice or a solution to buy or sell securities. Opinions are the authors; not necessarily that of OANDA Business Information & Services, Inc. or any of its affiliates, subsidiaries, officers or directors. If you would like to reproduce or redistribute any of the content found on MarketPulse, an award winning forex, commodities and global indices analysis and news site service produced by OANDA Business Information & Services, Inc., please access the RSS feed or contact us at info@marketpulse.com. Visit https://www.marketpulse.com/ to find out more about the beat of the global markets. © 2023 OANDA Business Information & Services Inc.

Former Craig
Latest posts by Former Craig (see all)
- Market Insights Podcast – US GDP, RBNZ holds, bitcoin soars - 28 February 2024
- Market Insights Podcast – Nvidia earnings, record highs for stocks - 23 February 2024
- EUR/USD – A bullish breakout or just further consolidation? - 22 February 2024