WTI prices is trading above 103.0 round figure once more. Prices were pushed higher by strong risk trends which saw major US stocks indexes clocking more than 1% gains each. The weekly report by Department of Energy was bullish as well, indicating a gain of 4.03 million barrels week on week. This figure is much higher than the 0.75 million estimated by analysts, but a similar report done by American Petroleum Institute raised expectations to 7+ million barrels instead, suggesting that the actual implied demand for WTI Crude is not as bearish as we once thought it was.
Nonetheless, it should be noted that prices weren’t exactly bearish yesterday to begin with even though the API numbers were atrocious. As such, it is no surprise that prices actually managed to ride on the DOE “bullish” surprise to break 103.0 resistance, and even though we’ve since suffered some slight pullback it is likely that further gains will be possible especially if risk trend remain positive during US session later.
Hourly Chart
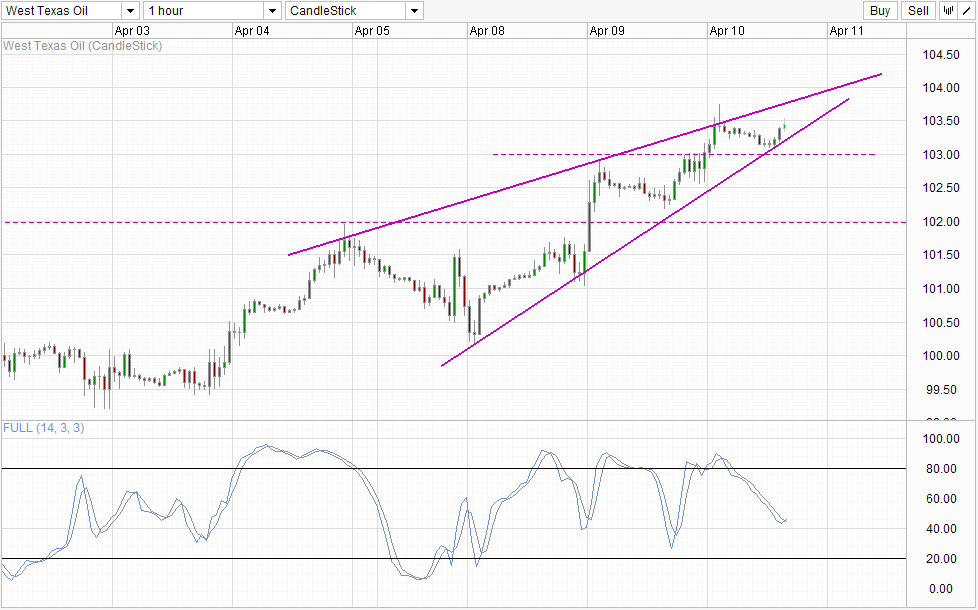
From a technical perspective, prices have rebounded from the lower wedge, which naturally opens up upper wedge as bullish target. Based on current pace, it is likely that price will also be around yesterday’s swing high when testing upper wedge, and as such if there is a break we can expect strong bullish acceleration higher. Stochastic indicator is also in favor of bullish endeavors as Stoch curve has crossed Signal line from below around the 40.0 “support” level.
Daily Chart
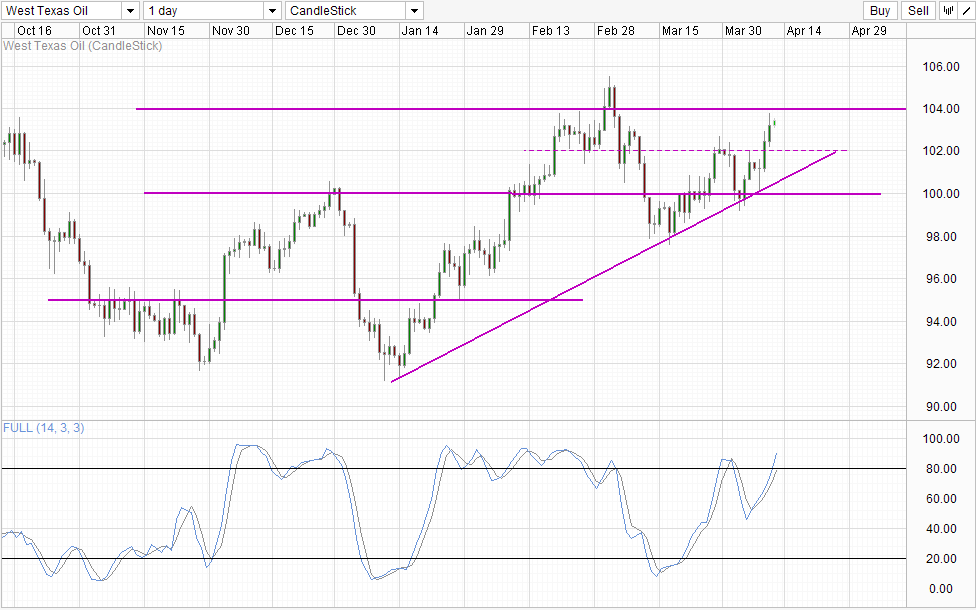
Daily Chart is less optimistic with 104.0 round figure resistance looming overhead, while Stochastic have reached Overbought levels not seen since the March decline. Hence, there is a niggling suspicion that bullish momentum may have overstretched itself. Couple this with weak bullish fundamentals, it is difficult to imagine WTI prices being able to enjoy further bullish follow-through above 104.0
What should traders do when S/T direction does not truly agree with L/T direction? Conservative traders may simply opt to stand aside, but if traders limit their risk exposure, it is still possible to ride the S/T wave higher. Alternatively, L/T traders may find current prices attractive to short but risk may be higher as there is no way to tell when bullish euphoria will end and certainly market can stay irrational longer than we can stay solvent.
More Links:
AUD/USD – More Gains Possible Despite China Letdown
Gold Technicals – Confirmation Of 1,315 Break Needed For Further Bullish PushGet OANDA’s exclusive weekly Market Pulse FX
This article is for general information purposes only. It is not investment advice or a solution to buy or sell securities. Opinions are the authors; not necessarily that of OANDA Corporation or any of its affiliates, subsidiaries, officers or directors. Leveraged trading is high risk and not suitable for all. You could lose all of your deposited funds.

Mingze Wu
Latest posts by Mingze Wu (see all)
- European Bourses Not Enjoying Bullish Winds From US Stocks - 17 April 2014
- More Aggressive Stimulus Possible Despite Premier Li’s Denial - 17 April 2014
- China March FDI -1.5% Y/Y vs +2.05% expected. First decline in more than a year. - 16 April 2014