US Stocks suffered a torrid day yesterday, led by a rout in Tech stocks which saw Nasdaq 100 shedding triple digit to clock in a 3.13% loss. S&P 500 came in second at 2.09% while Dow Jones Industrial Average was the best of the lot but still lost more than 250 points at -1.62%. What is disconcerting is the fact that prices of all 3 indexes headed lower on the get go without any bullish reprieve, reflecting a strong and steady bearish push. Also, the reason for the decline is the same group of stocks that led US stock prices higher earlier this week when US market was recovering from last Friday’s (and Monday’s) decline. Hence, the capitulation of the aforementioned stocks should be huge red flags that suggest bullish sentiment is shifting.
We can see other clues from latest economic news releases as well. Weekly Jobless Claims actually tumbled to a 7 year low, but that did nothing to soothe the market. Also, Fear Index VIX jumped 15%, a huge increase by any standards. There was also reports about a singular trading taking a $5.6 million bet that Russell 2000 index will fall by at least 2% by May. All these highlights the growing bearish sentiment that is developing, and points to further selling activities in the days ahead.
Hourly Chart

From a technical perspective, it is clear that a downtrend is developing. Even though Asian markets have been kinder to US stock futures, prices remained firmly below Tuesday’s swing low, showing that the bearish momentum remains strong and more bearish follow-through can be expected. In such strong bearish scenarios, S/T Stochastic indicators may be ignored as counter-trend signals tend to be less reliable. That being said, as today is the last trading day of the week, the likelihood of profit taking activities occurring becomes higher, and as such we should not be surprised if prices do rebound higher back towards 1,840+ by the end of today especially since a dead-cat bounce may be possible as well. However, if we do not see any sort of bullish response today, it will be yet another confirmation for the strong bearish follow-through and it is not difficult to imagine bearish momentum continuing next week.
Daily Chart
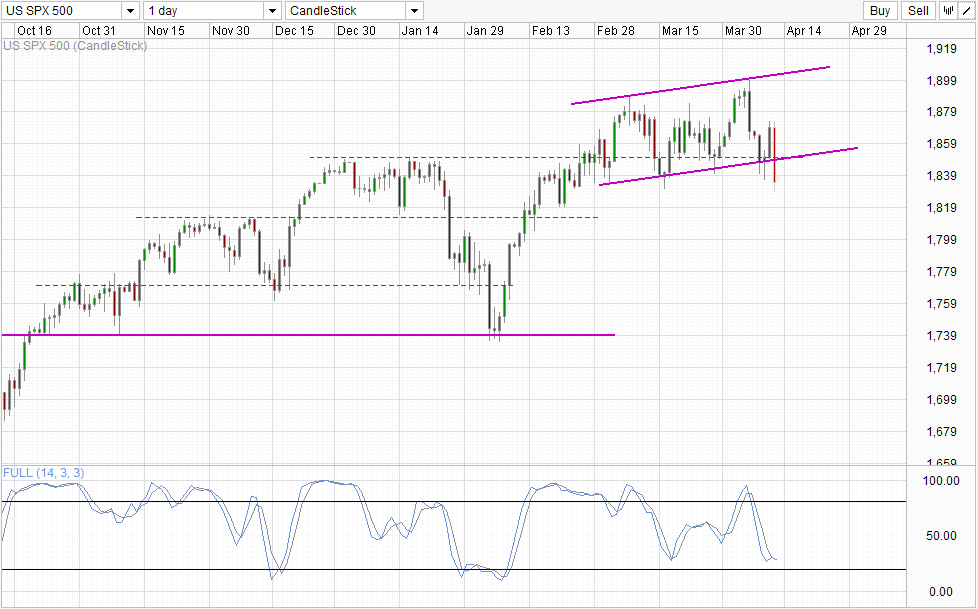
Price action on the Daily Chart concurs, suggesting that a move towards 1,812.5 is possible with the rising channel broken. Stochastic indicator remains bearish, with a bullish cross between Stoch/Signal line averted. As such, the bearish cycle can be expected to continue which is inline with a 1,812.5 bearish target.
Beyond 1,812.5 is difficult to guess though, as bearish momentum will likely be oversold on the Daily Chart. However, if current sell-off does translate to a significant shift in global sentiment, it is possible that we may see a continued bearish correction between 10-20% before significant rebound is seen.
More Links:
GBP/USD – Pound Slightly Lower As US Unemployment Claims Dip
AUD/USD – Higher As Australian Job Data Shines
USD/JPY – Yen Rally Continues Despite Strong US Unemployment Claims
This article is for general information purposes only. It is not investment advice or a solution to buy or sell securities. Opinions are the authors; not necessarily that of OANDA Corporation or any of its affiliates, subsidiaries, officers or directors. Leveraged trading is high risk and not suitable for all. You could lose all of your deposited funds.

Mingze Wu
Latest posts by Mingze Wu (see all)
- European Bourses Not Enjoying Bullish Winds From US Stocks - 17 April 2014
- More Aggressive Stimulus Possible Despite Premier Li’s Denial - 17 April 2014
- China March FDI -1.5% Y/Y vs +2.05% expected. First decline in more than a year. - 16 April 2014