So much movement, yet so little achieved. EUR/USD pushed all the way to 1.388 during early US session, but prices rebounded up in similar quick fashion bringing us back within the 1.392 – 1.394 band. In a way, our analysis yesterday was half right – expectations were for prices to stay within the 1.392 – 1.394 band, but some allowance was given for a dip to 1.39 similar to the sharp decline seen on Monday, but the huge volatility that was seen after the analysis was published showed that prices was certainly unexpected.
Delving deeper, we can see the first dive below 1.39 happened when weaker than expected German ZEW Survey numbers were released, but the strong rally that followed in the next hour was unexplainable other than the fact that inherent sentiment is bullish. However, the assertion that sentiment is bullish is weak when we notice that prices tanked heavily in the next few hours during early US session. There were less than positive economic data released such as weaker than expected US Consumer Price Index and Housing Starts, but US stocks were actually bullish during the same period, undermining the argument that EUR/USD is lower due to risk off appetite. Saying that USD strengthened because of stronger US stocks is also unsatisfactory as prices of EUR/USD is clearly positive correlated with bullish risk appetite for the latter part of US session. Therefore, we are once again back to our conclusion of yesterday – EUR/USD is direction-less and expected volatility is even higher than previously thought.
Hourly Chart
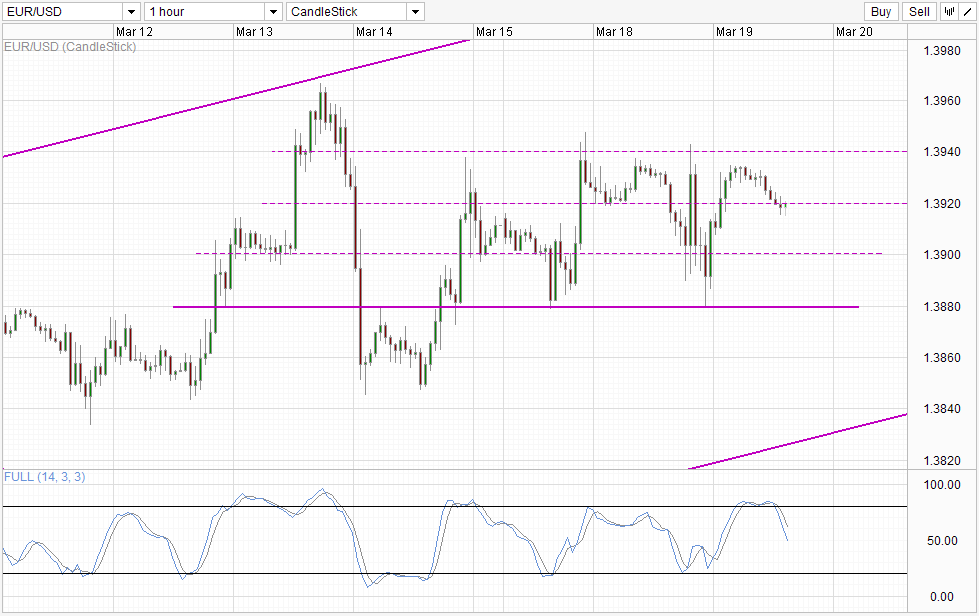
Given the huge uncertainty surrounding EUR/USD right now, it is hard to say whether 1.392 support will hold, and given the unpredictability of EUR/USD right now even if prices break 1.392, there is no guarantee that 1.39 can be reached even though Stochastic readings seems to favor a bearish cycle right now.
Daily Chart
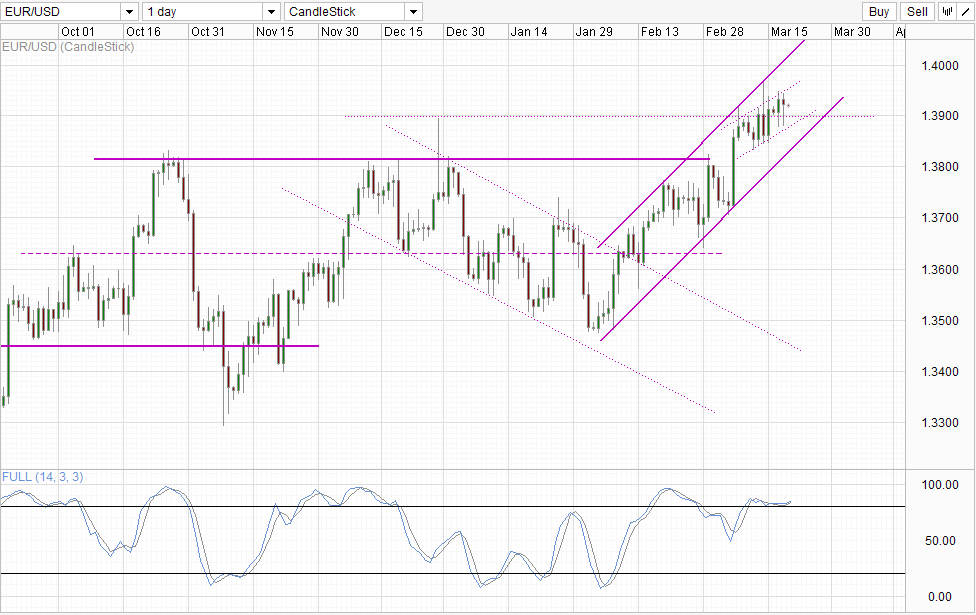
Daily Chart does not really give us any fresh new insights. Stochastic readings is flat within the Overbought region, and even though price appears to be trading within a narrow Channel in the past 2 weeks, the reliability of this Channel is suspect and the case for a push towards Channel Bottom (both the smaller and wider one) is not strong until Stoch curve starts to push below 80.0. A weak case for continued bullish move is also possible as price can be regarded to be on a bullish breakout right now above 1.39 resistance, which increases the possibility of a more meaningful test of the wider Channel Top. Hence, traders seeking directional play should seek further confirmation as everything is possible here.
More Links:
WTI Crude – Seaway Push Unable To Ward Off Global Bearish Factors
GBP/USD – Pound Lower As Nervous Markets Follow Ukrainian Saga
USD/CAD – Little Movement As Canadian Manufacturing Sales Shines
This article is for general information purposes only. It is not investment advice or a solution to buy or sell securities. Opinions are the authors; not necessarily that of OANDA Corporation or any of its affiliates, subsidiaries, officers or directors. Leveraged trading is high risk and not suitable for all. You could lose all of your deposited funds.

Mingze Wu
Latest posts by Mingze Wu (see all)
- European Bourses Not Enjoying Bullish Winds From US Stocks - 17 April 2014
- More Aggressive Stimulus Possible Despite Premier Li’s Denial - 17 April 2014
- China March FDI -1.5% Y/Y vs +2.05% expected. First decline in more than a year. - 16 April 2014