S&P 500 index closed at a record high yesterday, ending the day above the key 1,850 mark after 3 failed attempts earlier. This gain is surprising as bullish sentiment was actually weakening slowly during the past few days, and the risk of a more significant bearish reversal emerging was real as bulls are likely tired from the numerous tests of 1,850.
This risk did manifest yesterday when prices pushed lower during European session despite stronger German Unemployment numbers and Euro-Zone Consumer/Economic Confidence numbers, falling to a low of 1,735 within a couple of hours. Prices rebounded strongly higher during pre-market open hours for US stock exchanges, sending price back towards the 1,844/1,845 resistance and even managing to breach it shortly after that. This occurred even though a weaker than expected German Consumer Price Index was announced when price started to reverse higher. Certainly, a stronger than expected US Durable Goods Orders that was released half an hour later helped in the bullish push, but it should be noted that Goods Orders continued shrinking at -1.0%, albeit much slower than December’s -5.3%. As such, we should not be seeing such a strong bullish response coming out from this data release, especially since Initial Jobless Claims which was released during the same time came in worse than expected.
Hourly Chart
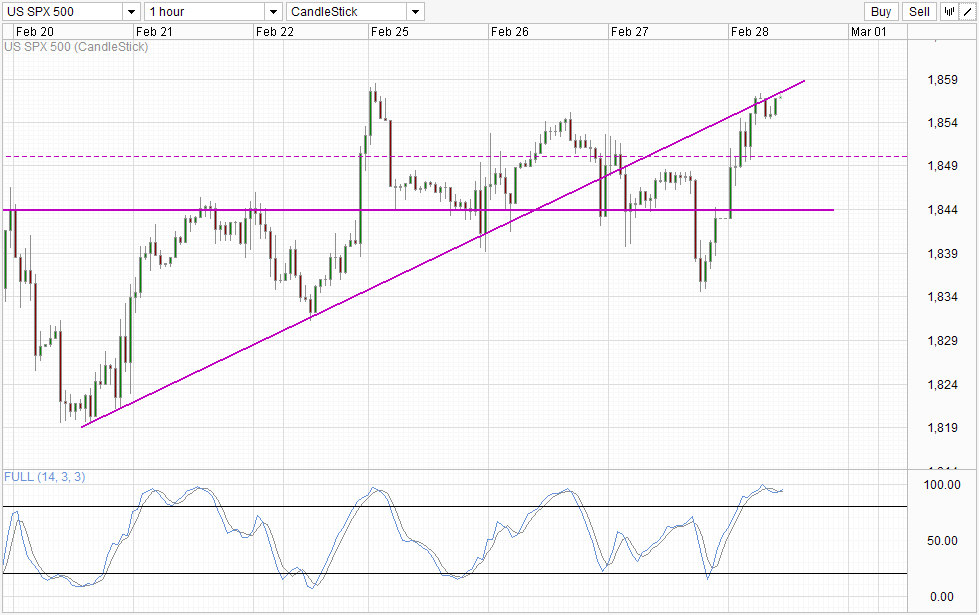
All these point to a strong irrational buying behavior of US stocks yesterday, and may be the result of speculators giving all they’ve got to attempt a close above 1,850. Now that we’ve reached the objective, it is likely that the bullish pressure will and has evaporated, increasing possibility of downside once again, and that could come in the form of prices breaking 1,855 soft support to lead us back down to 1,850 support once again.
Technicals agree as well – prices are trading below the rising trendline, while Stochastic readings are firmly within the Overbought region. Also, we remain below Monday’s peak, suggesting that the overall bullish pressure isn’t really that strong. That being said, confirmation will be needed to affirm our conjecture about bullish pressure dissipating
Daily Chart
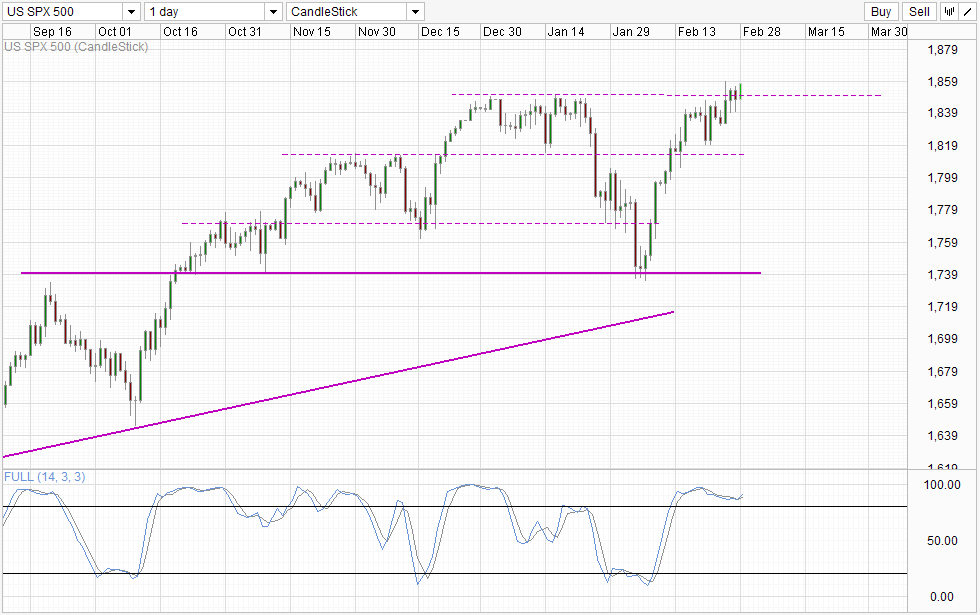
Nothing new on the Daily Chart that we haven’t seen this week. Prices have broken away from the 1,850 resistance but we are still lacking confirmation that a breakout is happening. With Stochastic readings currently deeply Overbought, it will be prudent to wait for stronger signs that bullish conviction has long-term follow-through especially since S/T bullish conviction is less than convincing.
More Links:
GBP/USD – Dealing with Resistance at 1.67
AUD/USD – Trying to Claw Back to Key 0.90 Level
EUR/USD – Regains Lost Ground back above Key Level of 1.37
This article is for general information purposes only. It is not investment advice or a solution to buy or sell securities. Opinions are the authors; not necessarily that of OANDA Corporation or any of its affiliates, subsidiaries, officers or directors. Leveraged trading is high risk and not suitable for all. You could lose all of your deposited funds.

Mingze Wu
Latest posts by Mingze Wu (see all)
- European Bourses Not Enjoying Bullish Winds From US Stocks - 17 April 2014
- More Aggressive Stimulus Possible Despite Premier Li’s Denial - 17 April 2014
- China March FDI -1.5% Y/Y vs +2.05% expected. First decline in more than a year. - 16 April 2014