Crude oil recovered yesterday – not a surprising move given that Tuesday’s decline was a tad too aggressive without any strong justification. Furthermore, there were positive economic numbers released yesterday – firstly we have US New Home Sales which grew 9.6% M/M when analysts were calling for a -3.4% shrinkage. This better than expected print sent S&P 500 higher and provided relief from “risk off” sentiment that was in play, and would have a positive impact on risk-correlated Crude prices. Half an hour after the news released, WTI Crude received yet another solid boost from the US Department of Energy weekly report which reflected a much lower than expected gain in Crude Inventory. Inventory for the week of Feb 21 increased by a mere 68K barrels versus an analysts consensus estimate of 1,275K barrels – a strong sign that implied demand for Crude remains strong.
Hourly Chart
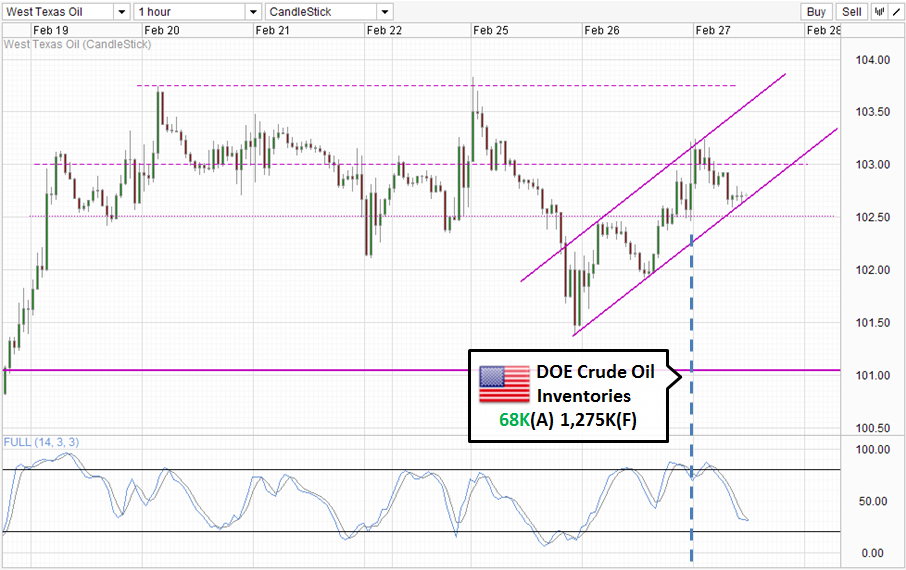
However, despite all these bullish factors, prices only managed to climb to a high of 103.25 yesterday. The immediate response from the combination of the 2 news releases fared even worse, with prices retracing more than 50% of the initial gains and closing a mere 25 cents a barrel higher within the hour of the 2 news. This is rather surprising as the explanation given by market watchers for Tuesday’s decline has been attributed to speculators pre-emptively shorting WTI Crude expecting a huge increase in inventory build up. Hence, at the very least we should be seeing WTI reclaiming back the losses suffered on Tuesday entirely if not climbing higher than Tuesday’s high.
The failure to do so highlights that WTI Crude is still inherently bearish, and even though prices are staying within a rising Channel right now, we cannot automatically assume that prices will rebound up higher as it is possible that Channel Bottom can be breached given the bearishness of WTI seen. That being said, Stochastic readings suggest that a rebound scenario is favored moving forward as Stoch and Signal lines are converging towards each other, implying that a Stoch trough may be formed soon. There is some precedence of this happening as we have seen similar troughs back on 19th and 24th Feb, but confirmation should be sought as the case for bullish endeavours from here out is highly suspect.
Daily Chart
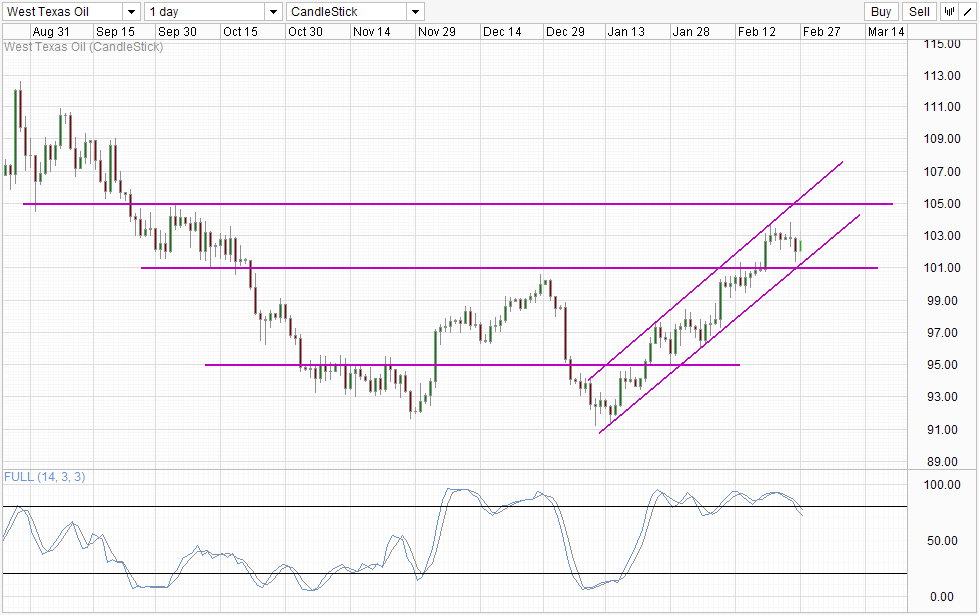
Things appear to be more bullish on the Daily Chart, but the move towards Channel Top is not fully opened with prices staying below last week’s ceiling and perhaps more critically below the 103.0 round figure. It is even debatable if the decline on Tuesday constitute a proper test of the Channel Bottom, as such all talks about prices rebounding higher from Channel Bottom to Channel Top is premature. With Stochastic readings showing a bearish cycle signal, traders wanting to go long now will need to be even more careful.
More Links:
GBP/USD – Receives Solid Support at 1.66
AUD/USD – Continues to Trade Around Key 0.90 Level
EUR/USD – Drops Sharply Below Key Level of 1.37
This article is for general information purposes only. It is not investment advice or a solution to buy or sell securities. Opinions are the authors; not necessarily that of OANDA Corporation or any of its affiliates, subsidiaries, officers or directors. Leveraged trading is high risk and not suitable for all. You could lose all of your deposited funds.

Mingze Wu
Latest posts by Mingze Wu (see all)
- European Bourses Not Enjoying Bullish Winds From US Stocks - 17 April 2014
- More Aggressive Stimulus Possible Despite Premier Li’s Denial - 17 April 2014
- China March FDI -1.5% Y/Y vs +2.05% expected. First decline in more than a year. - 16 April 2014