Gold tumbled yesterday, hitting a low of 1,309 during US session with the majority of the losses coming after the FOMC meeting minutes was released. It is actually rather interesting to see Gold trading lower because of the minutes as FOMC actually sound slightly more dovish than before. Certainly the minutes did reflect unanimous support for QE tapers, but this is not really news as market should have already priced in this when the 2nd taper cut was announced. What was unexpected from the minutes was actually the fact that Fed members are shifting away from unemployment rate as a gauge for hiking interest rates, with some members believing that interest rates need to be kept low for a longer period of time. This should have driven Gold prices higher as it is unlikely that the majority of the market would have priced in a continued low interest rates scenario that extends beyond 2015.
Hence, the decline in Gold prices is unlikely to be fundamentally driven, and the decline post FOMC minutes is an indication of the strong bearish sentiment of traders as they have selectively choose to interpret the minutes as hawkish – bearish for Gold.
Hourly Chart
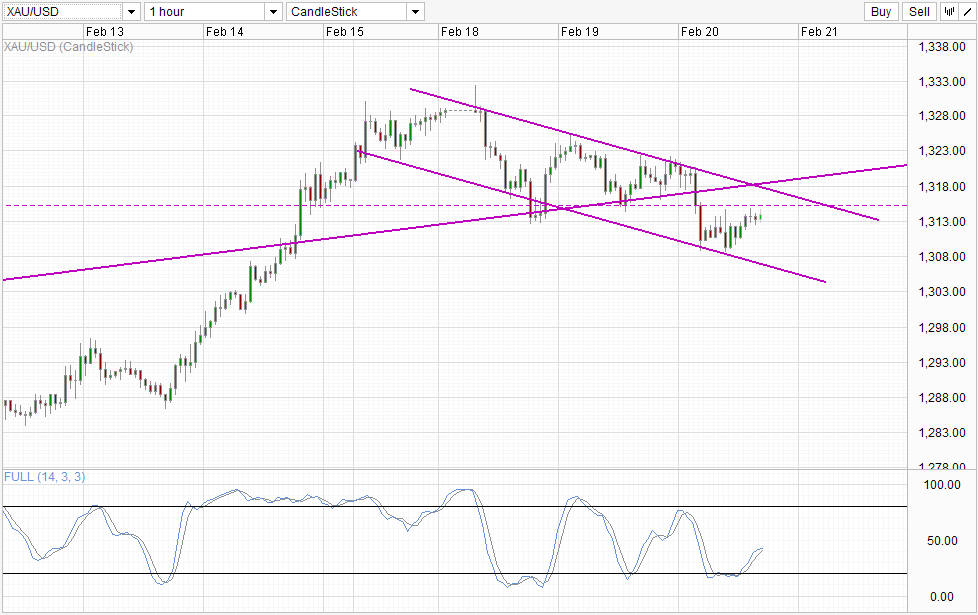
To be fair, the bearish momentum was already in play since the peak of Tuesday. Prices did rebound higher on Tuesday’s US session, but was capped by the descending Channel Top that is currently in play. Hence, we can also establish that even though underlying sentiment in Gold is now bearish, the magnitude of bearish strength isn’t really that formidable and is something that can be thwarted by technical pressures. All things said and done, what we can reasonably expect based on past behaviours (if they are relevant) is for prices to tag Channel Top once again after rebounding from Channel Bottom during Asian hours today. With risk appetite currently bearish – Asian and European Bourses are trading deeply in the red now – there will be stronger bullish pressure added which will help price to at the very least stay close to 1,315 resistance even in the case of strong bearish momentum.
Daily Chart

From the Daily Chart, we can see prices moving back within the rising Channel, while Stochastic indicator is showing the beginnings of a new bearish cycle, suggesting that price may be able to move towards Channel Bottom in the near/mid term – echoing the bearish sentiment seen in the Short-Term. However, given the strong support seen in our short-term analysis, do not expect price to do a free-fall, and a measured decline may be more realistic.
More Links:
EUR/USD Technicals – Stable As Bulls Hold On Tight Against Strong Risk Off Backdrop
AUD/USD Technicals – 0.90 Broken But Bulls Still Lurking Around 0.895
S&P 500 – Strongest Decline Since 3rd Feb
This article is for general information purposes only. It is not investment advice or a solution to buy or sell securities. Opinions are the authors; not necessarily that of OANDA Corporation or any of its affiliates, subsidiaries, officers or directors. Leveraged trading is high risk and not suitable for all. You could lose all of your deposited funds.

Mingze Wu
Latest posts by Mingze Wu (see all)
- European Bourses Not Enjoying Bullish Winds From US Stocks - 17 April 2014
- More Aggressive Stimulus Possible Despite Premier Li’s Denial - 17 April 2014
- China March FDI -1.5% Y/Y vs +2.05% expected. First decline in more than a year. - 16 April 2014