Mixed day for US stocks yesterday as S&P 500 gained slightly at +0.12% but Dow Jones Industrial Average was the opposite at -0.15%. Interestingly, Nasdaq 100 was actually relatively bullish, gaining 0.42% D/D, suggesting that risk appetite is alive and well as the tech heavy index is supposed to be risk sensitive. Considering that both major Asian and European stock indices closed higher yesterday, it seems reasonable to believe that overall risk appetite yesterday was bullish. As such, the lack lustre response from S&P 500 and the bearish move in Dow Jones Industrial Average suggest that all is not well with US stocks, and a potential bearish reversal may be just around the corner.
Hourly Chart
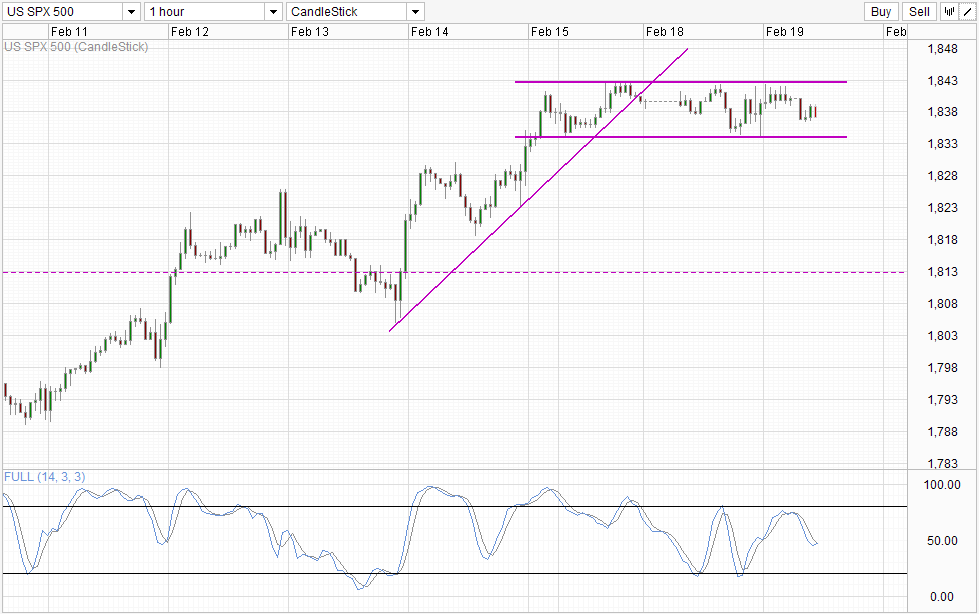
That being said, broad global risk appetite will continue to support S&P 500. Looking at price action, even though the ascending trendline has been broken on Monday, we’ve not seen any significant bearish pullback with prices staying within the consolidation zone between 1,834 – 1,843 for the past 24 hours. Hence, even though prices is pulling back down currently, expect 1,834 to put up adequate support.
Nonetheless, this does not invalidate the bearish risk mentioned above. Should broad global risk appetite start to fall again, it will be easy to imagine prices breaking 1,834 which opens up a potential move all the way towards 1,812.5, with 1,829.5 and 1,820 providing interim support.
Daily Chart
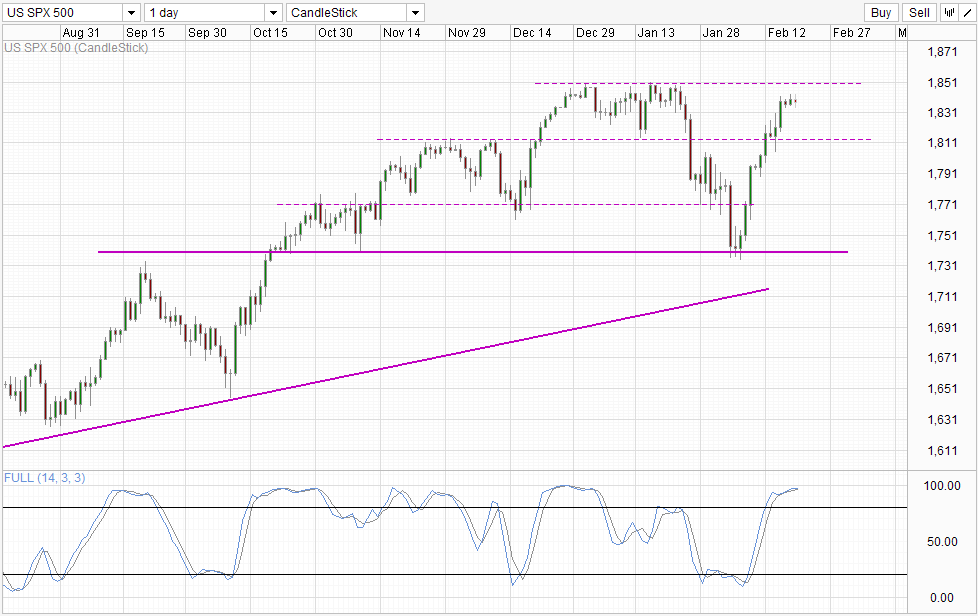
Daily Chart agrees with this bearish outlook as Stochastic readings are currently extremely Overbought with Stoch curve looking to cross Signal line in the immediate future. 1,850 resistance is the obvious bullish target for current rally which started on 5th Feb, which would mean that prices should have some further room for bullish growth. However, it should be noted that we’ve yet to see any significant bearish pullback since the onset of this bull trend. Hence, the likelihood of a bearish pullback now becomes that much higher especially since S&P 500 and Dow Jones Industrial Average are both showing sign of weakness. As such, it will not be too surprising to see price starting to come off from here without testing 1,850.
Fundamentally, there are good reasons why US risk sentiment should be heading south. Empire Manufacturing for month of Feb came in at 4.48 vs 9.0 expected even though analysts have already factored in a slower rate of growth compared to previous month’s 12.51. Net Long Term Treasury International Capital (TIC) numbers have also fallen, reflecting a -$45.9B vs +30.0B expected. A negative TIC shows that there is a net outflow of funds from the US, and that is definitely not good news for US stocks in the long run. Even if prices of US assets do increase, it will at the very least lag behind global equities counterparts.
More Links:
GBP/USD – Steady as CPI Dips Below 2.0% Level
USD/CAD – Rangebound Trade Continues
AUD/USD – Listless After RBA Minutes
This article is for general information purposes only. It is not investment advice or a solution to buy or sell securities. Opinions are the authors; not necessarily that of OANDA Corporation or any of its affiliates, subsidiaries, officers or directors. Leveraged trading is high risk and not suitable for all. You could lose all of your deposited funds.

Mingze Wu
Latest posts by Mingze Wu (see all)
- European Bourses Not Enjoying Bullish Winds From US Stocks - 17 April 2014
- More Aggressive Stimulus Possible Despite Premier Li’s Denial - 17 April 2014
- China March FDI -1.5% Y/Y vs +2.05% expected. First decline in more than a year. - 16 April 2014