No crazy 1% gains yesterday, but stocks managed to hold onto their hard earn gains of Friday and then some. S&P 500 closed 0.16% higher, while Dow Jones was much more modest at 0.05%. Nasdaq 100 is once again the biggest winner with a 0.57% gain, suggesting that overall risk appetite remains bullish as the tech heavy index is the most sensitive towards risk trends (highest market Beta) historically. Considering that there wasn’t any major economic news announcement yesterday, this continued bullish risk appetite suggest that further upside is possible especially if/when actual bullish data comes in. Even if data is bearish (e.g. Yellen’s speech today which is expected to talk about further tapering), this bullish sentiment will provide some buffer, limiting bearish damage.
Hourly Chart
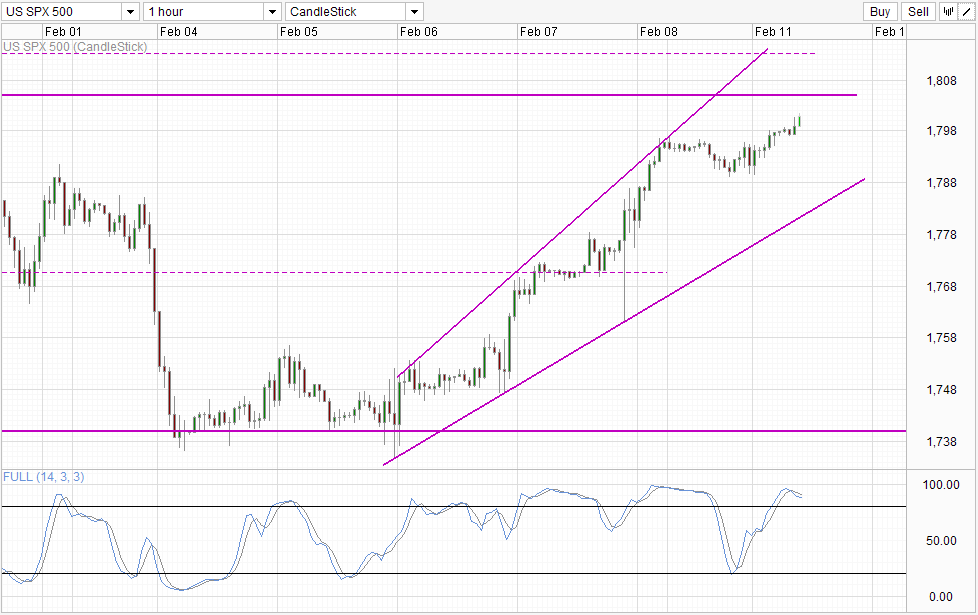
What is actually more interesting right now is that S&P 500 futures is actually trading higher during Asian hours, pushing higher beyond the US session highs – the first time we’ve observed something like this since the bullish recovery that started on 4th Feb. This suggest that sentiment in US stocks is indeed more bullish than before, affirming the assertion above that bullish sentiment is reigning.
From a technical perspective, the obvious bullish target for now will be 1,805 which is the previous swing high seen on 29th Jan. However, the full potential of this bullish move is actually higher, capped by 1,812.5 significant resistance and subsequently upper wedge if the aforementioned resistance is broken. If Janet Yellen turns out dovish today, it will not be surprising to see the already currently bullish market overreact to hit the target levels mentioned.
Without the bullish fundamental news it becomes harder to imagine prices breaking 1,812.5 though, as momentum appears heavily Overbought already, and stoch curves are currently pointing lower even as prices are pushing higher, and this divergence is not a good encouragement for further bullish momentum from a pure technical perspective. Hence, even though market is indeed bullish, any positive data that can fuel current run will certainly be welcomed from here out.
Daily Chart
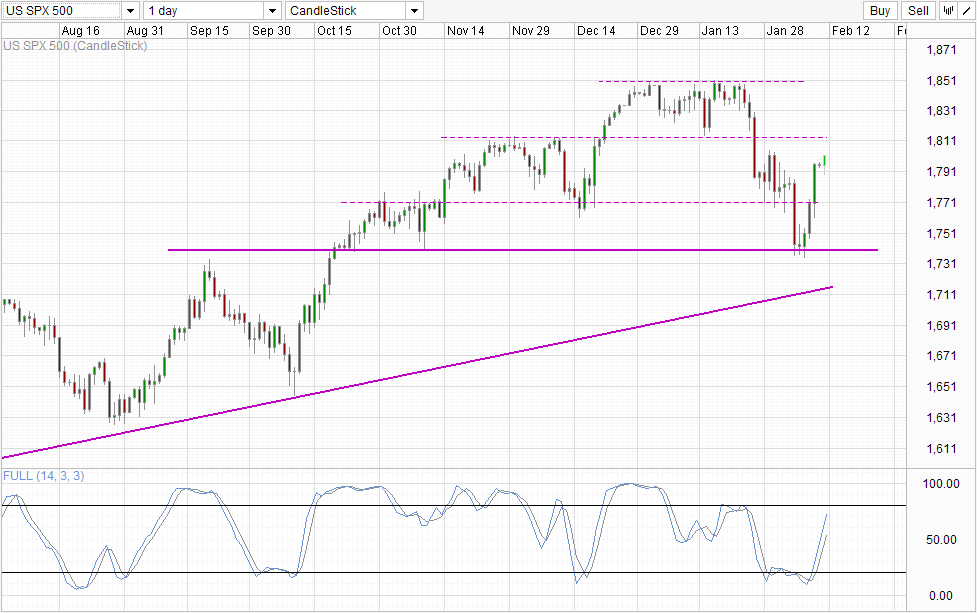
Daily Chart agrees with this outlook, as Stoch curve is close to the Overbought region and will likely enter into Overbought when prices test 1,812.5. In fact, we may not even need to wait until Overbought to see a stoch reversal seeing that Stoch curve has u-turned below 80.0 levels back around 11th Dec and 18th Jan. However, should 1,812.5 is broken, hitting 1,850 becomes possible, but similar to what Short-term analysis has concluded – a shift in fundamentals is needed in order to provide further conviction that can allow prices to ignore the “overbought” nature of current momentum to prevent significant pullbacks between now and hitting our objectives.
More Links:
EUR/USD – Making a Push Through Resistance at 1.3650
AUD/USD – Threatening the Resistance Level at 0.90
GBP/USD – Pound Settles Down After Recent Gains
This article is for general information purposes only. It is not investment advice or a solution to buy or sell securities. Opinions are the authors; not necessarily that of OANDA Corporation or any of its affiliates, subsidiaries, officers or directors. Leveraged trading is high risk and not suitable for all. You could lose all of your deposited funds.

Mingze Wu
Latest posts by Mingze Wu (see all)
- European Bourses Not Enjoying Bullish Winds From US Stocks - 17 April 2014
- More Aggressive Stimulus Possible Despite Premier Li’s Denial - 17 April 2014
- China March FDI -1.5% Y/Y vs +2.05% expected. First decline in more than a year. - 16 April 2014