Stupendous gain in US stocks was seen yesterday, with all 3 major stock indexes gaining more than 1%. S&P 500 and Nasdaq clocked in 1.24%, while Dow Jones Industrial Average was slightly more “modest” at 1.22%. This rally has been attributed to the surprise decline in Continuing and Initial Jobless Claims, allaying fears that the recovery in US economy has stalled.
However, this explanation becomes weaker when we look at all the other economic data that was released yesterday. Firstly, there are signs that employers are seeking to cut more jobs in the future according to Challenger Job Cuts survey, while RBC Consumer Outlook Index falling from 51.5 to 50.4. Trade Balance is also worse than expected at -$38.7B. Hence, if one were to paint a full picture of US economy outlook, “bullish” is definitely not correct answer especially since the decline in Continuing Claims and Initial Jobless Claims are not that significant as well.
Therefore, the conclusion is clear: market participants are choosing to focus on the good news and ignoring the bad – not really a surprise considering that the same was done on Wednesday when a worse than expected ADP employment data was released.
Hourly Chart
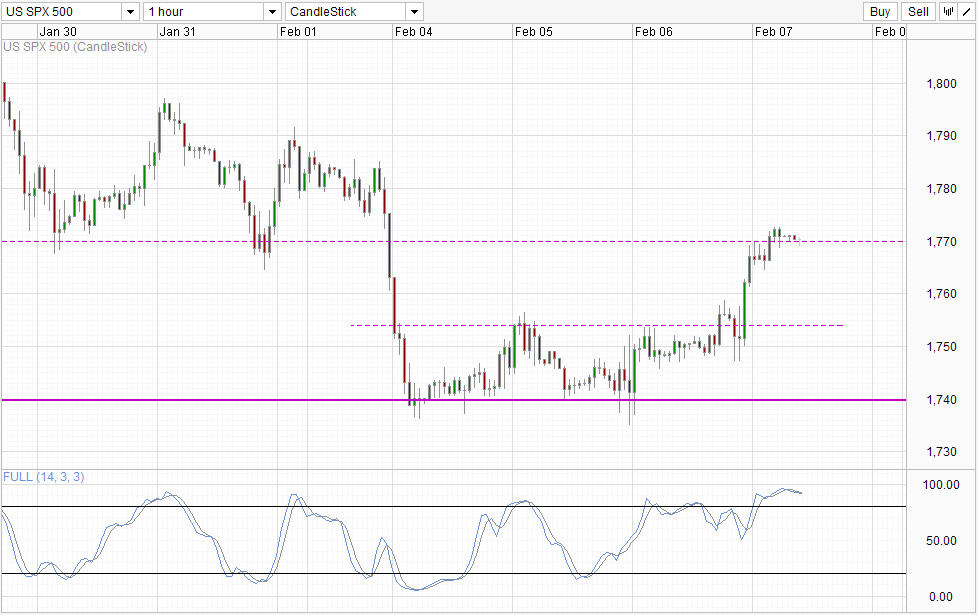
As such, the rally to above 1,770 resistance is not based on true fundamentals, but overreaction by the mild bullish sentiment combined with technical pressure when 1,754-1,755 resistance broken. This increases the likelihood of prices rebounding off 1,770 resistance as there is nothing to justify such an increase. Even in the event that prices push beyond 1,770, the bullish follow-through may be limited.
Stochastic agrees as the Stoch curve is currently pointing lower after hitting the highest Overbought levels since 23rd December. There is no bearish cycle signal as of now, but we will have a show of strong bearish conviction should price breaks below 1,765 in conjunction with Stoch curve hitting below 80.0. This confirmation is important as there is no telling if the irrational strong bullish sentiment is still in play. Furthermore, with Non-Farm Payroll risk event looming, the downside risk may actually be limited as market may once again overreact to mild bullish numbers but ignore a weak print. As such, traders wishing to play the rebound of 1,770 have more reasons to be more cautious, or wait until post NFP before committing heavily.
Daily Chart
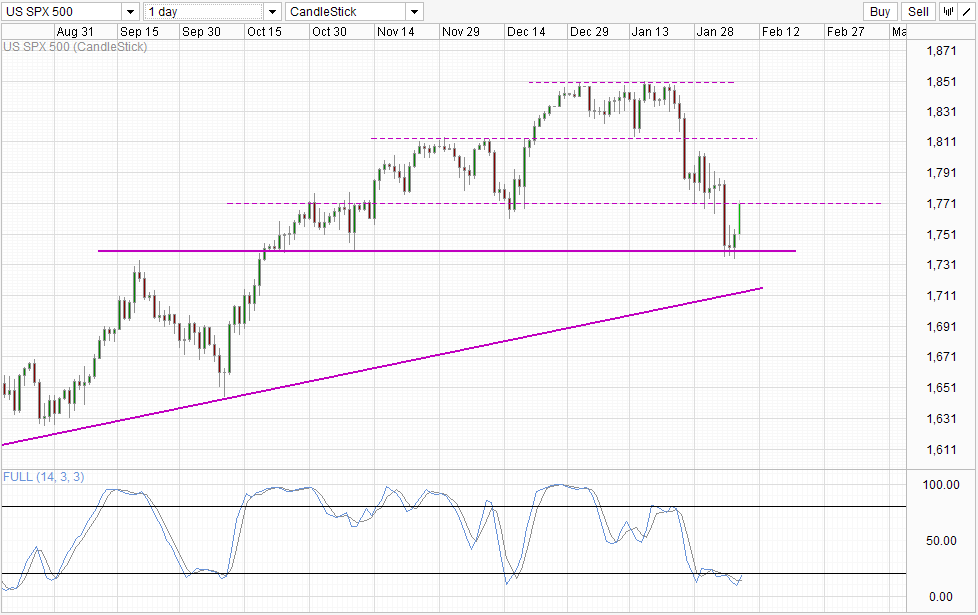
The importance of 1,770 can also be seen on the Daily Chart. Should 1,770 holds, the decline from Jan will continue which may bring us back towards 1,740 and beyond. However, it is possible that prices may still consolidate between 1,740 – 1,770 for an extended period of time as bears prime themselves for the next leg of bearish extension as this would allow those who were already shorting to take profit, and re-sell once more when prices are below the 1,740 key support.
More Links:
AUD/USD – Starting to Challenge Resistance at 0.90
EUR/USD – Surges Through Key Level of 1.3550
GBP/USD – Establishing Range Between 1.6250 and 1.6350
This article is for general information purposes only. It is not investment advice or a solution to buy or sell securities. Opinions are the authors; not necessarily that of OANDA Corporation or any of its affiliates, subsidiaries, officers or directors. Leveraged trading is high risk and not suitable for all. You could lose all of your deposited funds.

Mingze Wu
Latest posts by Mingze Wu (see all)
- European Bourses Not Enjoying Bullish Winds From US Stocks - 17 April 2014
- More Aggressive Stimulus Possible Despite Premier Li’s Denial - 17 April 2014
- China March FDI -1.5% Y/Y vs +2.05% expected. First decline in more than a year. - 16 April 2014