Implied yield of 10Y Treasury Note hit a high of 3.06% last week, but that did not result in any strong sell-off as expected. This is actually relatively surprising as many structured financial products are linked to 10Y yields, and one would have imagined that there will be a huge scurry for structurers and funds to hedge/cover their exposures after enjoying low interest rates for the past 2 and a half years. Some may think that a mere 0.06% above the 3.0% line in the sand may not be significant, but we need to remember that the affected is in hundreds of billions if not trillions (FX interest transactions is around 3 Trillion daily), and when we consider that banks and funds may be trading on leverage, a 0.06% difference can bankrupt firms.
To be fair, volatility of interest rates have picked up according to SRVX (CBOE Interest rate Swap Rate Volatility Index), but we are actually lower than 100.0 (level at the start of inception back in June 2012), and a far cry from 2013 high of 112.03 back in September, when market was expecting Fed to taper QE during the month’s FOMC meeting. It is clear that market is calm even, but why?
Yields movement of the past 2 trading days may give us a good answer – even though the first day of trading in 2014 opened at 3.06%, yields climbed down continuously to hit 2.99% on Friday. Perhaps the market is feeling secure and assured that rates will not climb up too much beyond 3.0%, and the quick descend from 3.06% is a clear indication that we have strong defenders of the 3.0% level keeping yields in check.
Hourly Chart
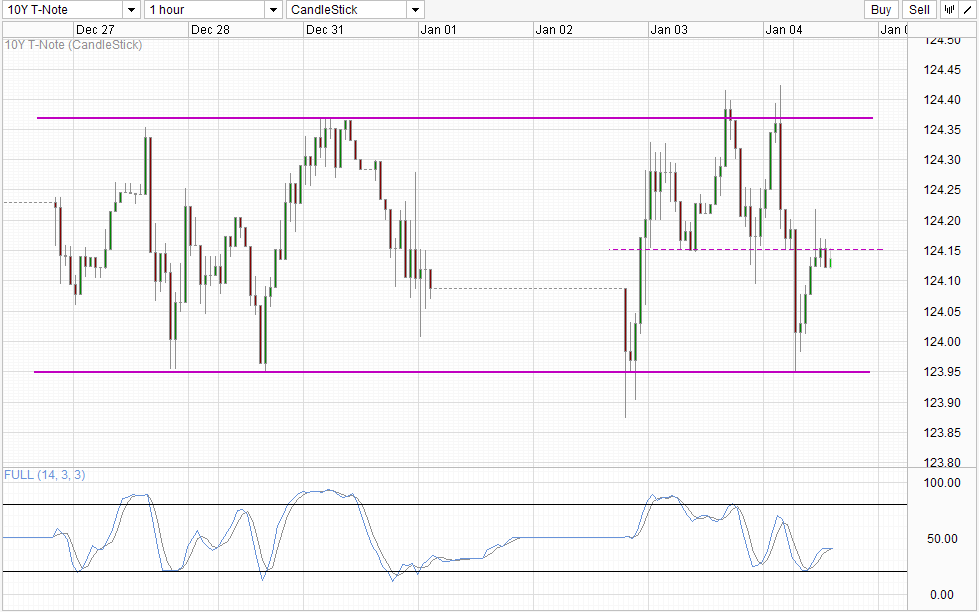
Prices have rebounded up slightly, but yields remain touching distance from 3.0% even when 3.0% is breached. When we consider that SRVX has fallen steadily since the peak in Mid December, the likelihood of a bullish breakout from 3.0% diminishes even more.
This also means that the likelihood of 10Y Futures breaking the support around 123.95 becomes lower, and we could be seeing 10Y prices staying within this new consolidation for an extended period of time. Technicals favor movement towards 123.95 with prices staying underneath the soft resistance of 124.15. Stochastic concurs with Stoch/Signal line looking likely to point lower soon which will signal a continuation of the bearish cycle. Current stoch level also supports the holding of 123.95 as readings will most likely be within Oversold when 123.95 is tested, echoing what has been said previously.
Weekly Chart
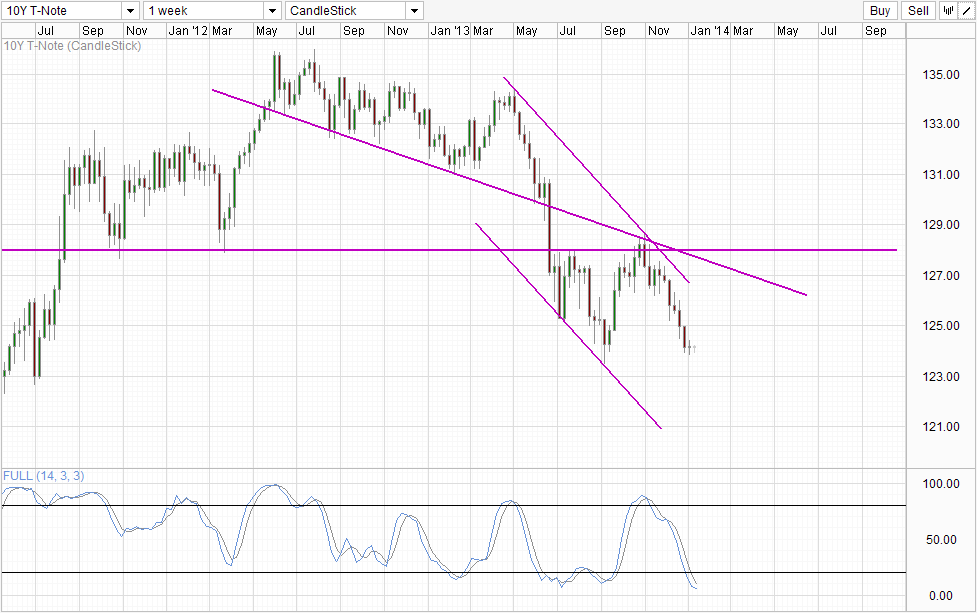
It should be said that long-term direction for 10Y prices should still be bearish though. For every tapering action that the Fed undertakes, defenders of the 3% line will need to fork out at least the same amount monthly just to make up for the loss in Fed purchases. When we add in speculators and other market participants that are either actively selling or buying less than before in line with Fed action, the number becomes much higher. With each additional taper, the number will increase further. Banks and private investors are rich, but they are definitely not Fed reach, and it will simply be a matter of time when the 3% level fail and 10Y Future prices break 2013 lows of 123.5 and head towards Channel Bottom which will be close to 100.0 when that happens looking at current rate of decline with small pullbacks factored in. This would translate to around 6% implied yield, close to historical average before QE distorted yields.
More Links:
AUD/USD Technicals – 0.895 Key For S/T Direction
EUR/USD Technicals – Triple Top Formed, Awaiting Confirmation
Gold Technicals – Trading Within S/T Bullish Channel
This article is for general information purposes only. It is not investment advice or a solution to buy or sell securities. Opinions are the authors; not necessarily that of OANDA Corporation or any of its affiliates, subsidiaries, officers or directors. Leveraged trading is high risk and not suitable for all. You could lose all of your deposited funds.

Mingze Wu
Latest posts by Mingze Wu (see all)
- European Bourses Not Enjoying Bullish Winds From US Stocks - 17 April 2014
- More Aggressive Stimulus Possible Despite Premier Li’s Denial - 17 April 2014
- China March FDI -1.5% Y/Y vs +2.05% expected. First decline in more than a year. - 16 April 2014