Hourly Chart
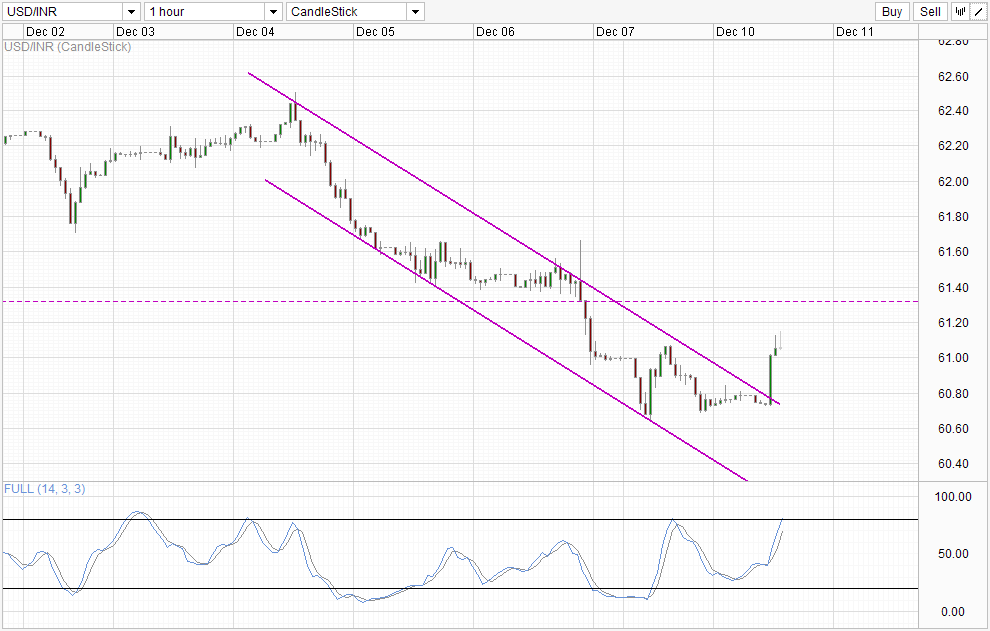
USD/INR saw a sudden spike this morning, a reflection of the decline in India’s main stock index Sensex. However, before Rupee bears get too carried away, it should be noted that the decline in Sensex is merely a profit taking exercise after prices have hit a record high the day before. Hence, traders hoping for a strong bullish follow-through of current Channel Breakout may be disappointed to know that reasons for further weakness in INR just isn’t there.
On the USD front, price action of Gold and US Stocks showed that market may be once again getting immune from QE Tapering fears, and hence USD may not be as bullish in the short run as well even if the Fed does implement a cut in QE next week. Furthermore, the lack of Tapering Fears means that US stocks may be able to climb higher with less inhibitions, which will weaken USD as the need for safe haven will be lower. Even though long-term direction for USD/INR remains higher due to the discrepancy between US and India’s economic strength, there is very little bullish ongoing in the short-term.
From a pure technical perspective, price may have pushed a fresh weekly high but bulls will need to clear 61.3 resistance and preferably above 61.4 in order to show that the bullish conviction has legs to run. However stochastic does not favor such a move with Stoch Curve already within the Overbought region, and we shouldn’t be surprise if prices fail to break the 61.3 resistance or perhaps even reverse lower here .
Weekly Chart
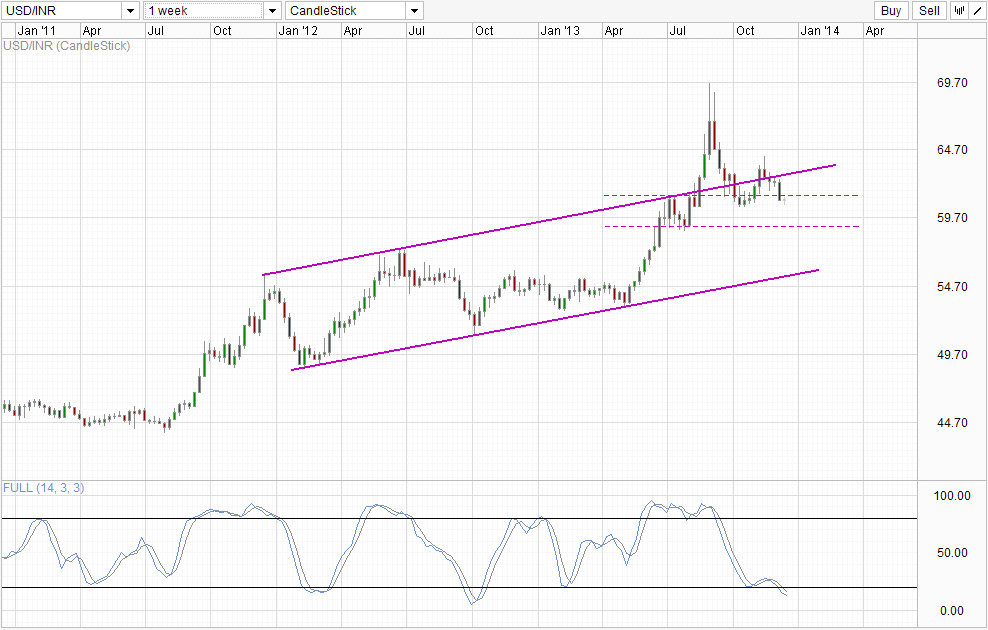
Not much development from the Weekly Chart though, as price will need to hit below 60.5 and above 61.3 for stronger directional signals. Stochastic is not exactly helpful here as both Stoch/Signal lines are pointing lower despite being within the Oversold region, and considering that this is the Weekly Chart, it may take 2-3 more weeks at the minimum before a proper bullish cycle signal can emerge. Nonetheless, should prices close around current levels and close above 61.3 in the following week, the likelihood of a false break into the 59.0 – 61.3 consolidation zone increases, and the long-term uptrend will be in play which opens up Channel Top as a viable bullish target.
More Links:
GBP/USD – Moving Back Towards Resistance Level of 1.6450
AUD/USD – Maintains Ground above 0.91
EUR/USD – Looks Towards Resistance Level at 1.38
This article is for general information purposes only. It is not investment advice or a solution to buy or sell securities. Opinions are the authors; not necessarily that of OANDA Corporation or any of its affiliates, subsidiaries, officers or directors. Leveraged trading is high risk and not suitable for all. You could lose all of your deposited funds.

Mingze Wu
Latest posts by Mingze Wu (see all)
- European Bourses Not Enjoying Bullish Winds From US Stocks - 17 April 2014
- More Aggressive Stimulus Possible Despite Premier Li’s Denial - 17 April 2014
- China March FDI -1.5% Y/Y vs +2.05% expected. First decline in more than a year. - 16 April 2014