Hourly Chart
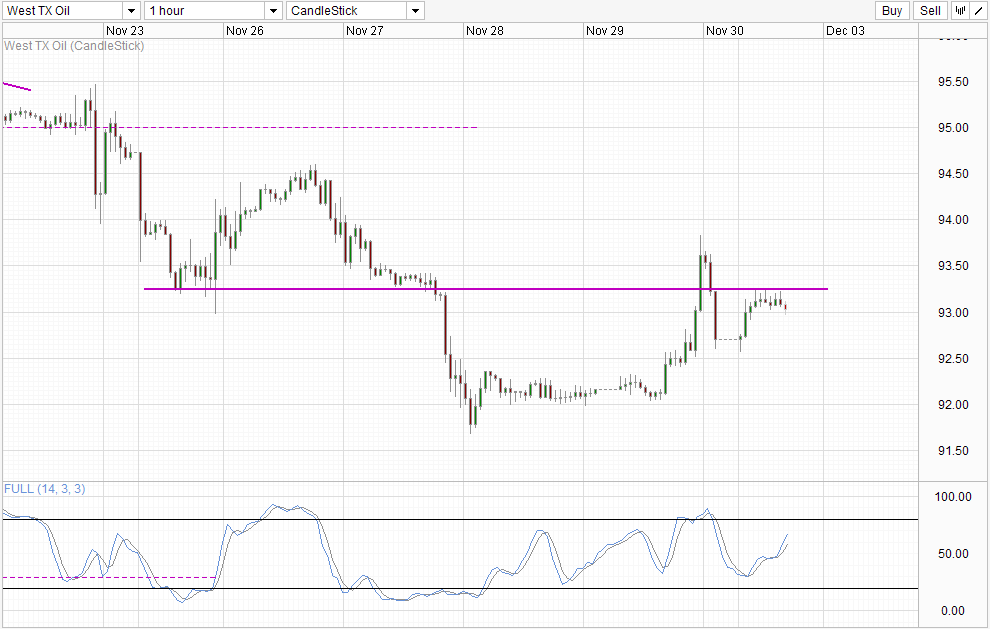
Crude Oil prices received a boost this morning due to China Manufacturing PMI numbers that were released over the weekend. The latest official PMI numbers has beaten analysts estimates, suggesting that the fears of a continued slowdown in China may be over-exaggerated. Fears that the official numbers are “too optimistic” were unfounded as the private surveys done by HSBC/Markit managed to beat estimates as well. However, the pace of growth is slightly lower compared to the previous month, unlike the official figures which matched October’s numbers, which does take the shine off this bullish print.
This may be part of the reason why prices remained below the 93.25 resistance even though risk appetite was strong during Asian hours. Failure to breach 93.25 opens up a move back towards 92.0+ levels, and currently price is testing 93.0 round figure (and soft support), with bearish acceleration expected should the level gets broken.
Stochastic readings suggest that bullish momentum isn’t fully over with Stoch curve still a fair distance beneath the Overbought region. However, given that previous peaks have been seen around 70.0, it will not be too surprising if Stoch curve reverse lower from here and add as a confirmation for the bearish push towards 92.0.
Daily Chart
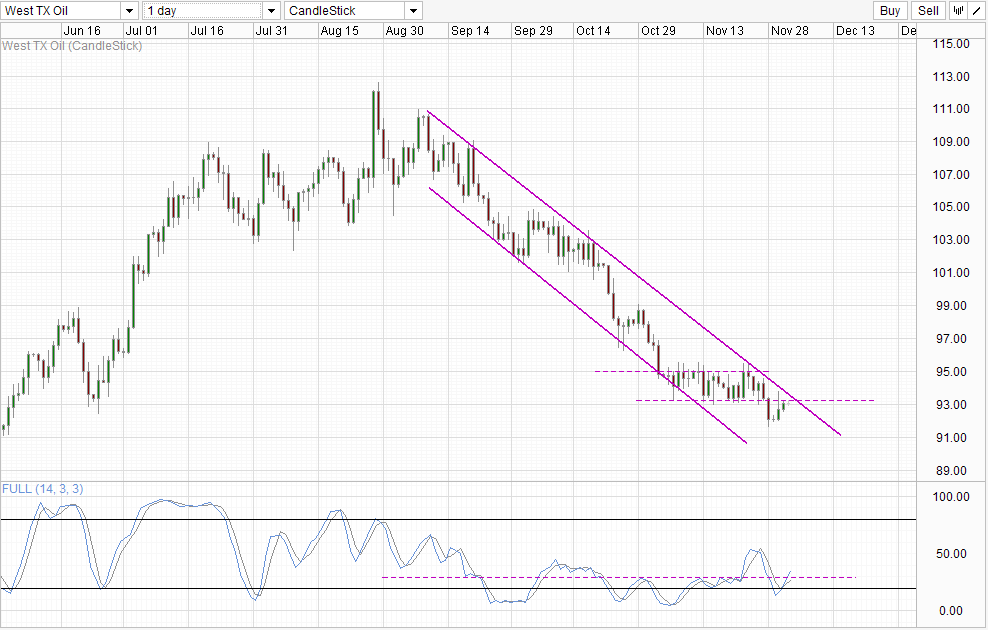
Daily Chart supports the bearish outlook, with prices facing not just the 93.25 resistance but also additional bearish pressure from the descending Channel Top. However, unlike Short-Term chart where a bearish move is already visible, there is no evidence that bullish momentum (or the bullish recovery from 29th November) is over. Stochastic agrees with Stoch curve actually pushing above the “resistance” of 30.0. Nonetheless, overall bearish pressure is immense, and Stoch curve will need to clear above 50.0 level before true bullish momentum can be considered. Similarly, even if price manage to push above Channel Top, ideally price will need to clear above 95.0 resistance before long-term bullish correction can be contemplated.
This notion is also supported by Fundamentals. Production from US is ever increasing and the country is expected to take over the title of world largest producer by the end of 2015. Recent Nuclear Agreement with Iran has also cooled the turmoil in Middle East, resulting in less speculative play in Oil due to fear. With global demand falling (as evident by the slowdown in OPEC production – in order to keep prices lifted), WTI Crude prices is expected to continue falling in 2013 and well into 2014.
That doesn’t give carte blanche for bears though, keep in mind that from a long-term perspective the recovery momentum is still in play. Furthermore, it seems that bulls are not going down without putting up a fight – see the sudden rise in WTI prices last Friday which was not triggered by any fundamental news releases. Hence traders should certainly be wary and do not automatically assume that it will be a smooth journey south from here on.
More Links:
USD/JPY – BOJ Kuroda Unfazed By Low Capital Spending
Gold Technicals – Moving Sideways With Bumpy Week Ahead
AUD/USD – Finds Solid Support at 0.91
This article is for general information purposes only. It is not investment advice or a solution to buy or sell securities. Opinions are the authors; not necessarily that of OANDA Corporation or any of its affiliates, subsidiaries, officers or directors. Leveraged trading is high risk and not suitable for all. You could lose all of your deposited funds.

Mingze Wu
Latest posts by Mingze Wu (see all)
- European Bourses Not Enjoying Bullish Winds From US Stocks - 17 April 2014
- More Aggressive Stimulus Possible Despite Premier Li’s Denial - 17 April 2014
- China March FDI -1.5% Y/Y vs +2.05% expected. First decline in more than a year. - 16 April 2014