Hourly Chart
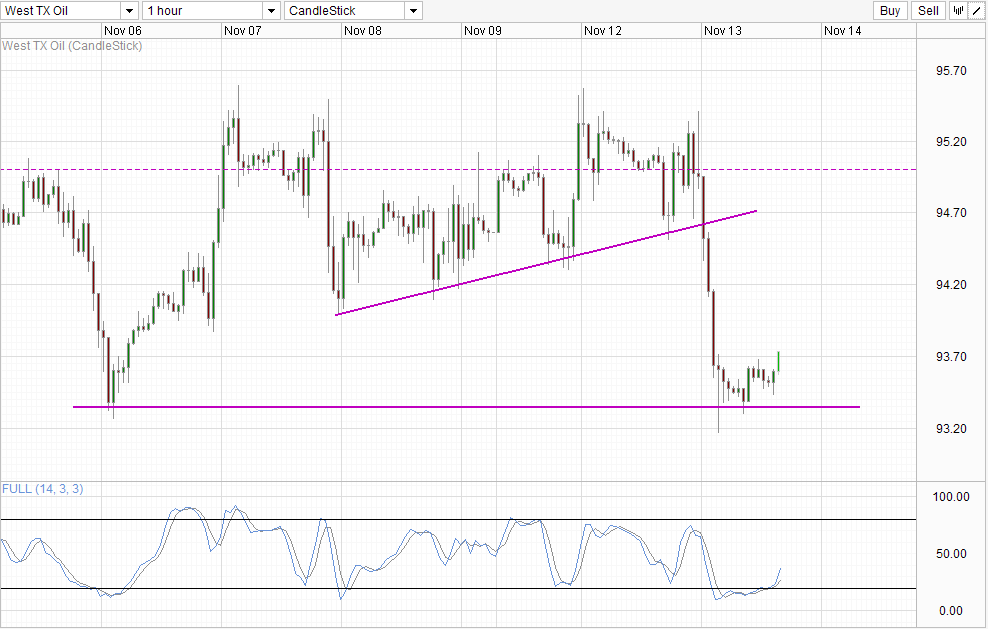
WTI prices hit a new 5 month low yesterday after speculators drove USD higher believing that the Fed will taper its current QE program in December. However, this new low is only marginally below the previous low set on 6th Nov, hence we should not read too much into it. Furthermore, the newly formed low did not manage to inspire a “breakout”, with signs of bullish pullback/recovery in play right now.
Stochastic readings are showing a new bullish cycle signal, while price is currently breaking above the soft resistance of 93.65. This suggest that a move towards 94.2 or even higher objectives is possible especially if we see a full bull cycle from Stochastic.
Daily Chart
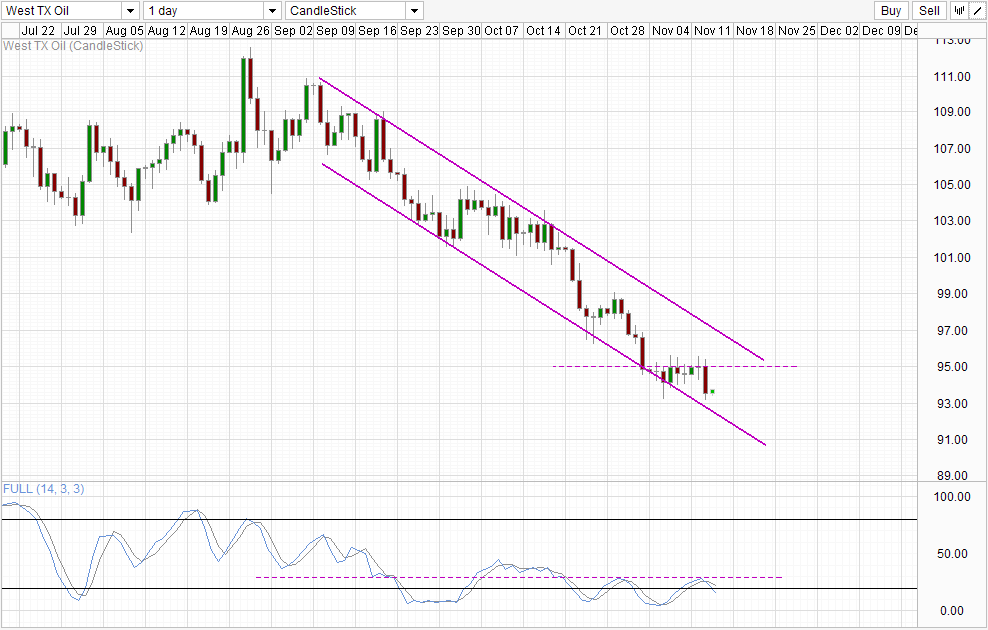
However, prices remain heavily bearish from the Daily perspective, with yesterday’s decline affirming the 95.0 resistance. Stoch readings are currently within the Oversold region, but there is still some space allowance before a trough is formed looking at previous troughs. Hence, we could still see prices heading lower and tag Channel Bottom before a stronger rebound take place. It should be noted that this outlook does not invalidate short-term bullish momentum. As prices did not manage to tag Channel Bottom earlier, the bearish move is still not over, hence all this means is that short-term bullish recovery may be cut short and reverted lower once again.
Today’s Department of Energy inventory numbers will be yet another potential bearish driver. But last week’s data was actually not as bearish as expected, and there is a chance that the supply/demand conditions will improve once again this week. This notion is agreed by analysts who expect stockpiles to grow by a mere 0.8 million barrels, much lower than the past 7 weeks estimates. Traders will do well to gauge market sentiment by analyzing the post announcement reaction. Should inventory grow higher than expected but WTI prices grow higher, this may imply that market may be pricing in an improving scenario. Conversely, should inventory grow lesser than expected yet prices head lower by the end of the day, we can take it as a sign that market remains heavily bearish – which will drive prices lower for now but a shift in fundamentals may be slowly happening as well, giving us an upside risk in the future.
More Links:
EUR/USD Technicals – 1.345 Resistance Holding Up
Gold Technicals – Moving Closer to 1,250
AUD/USD Technicals – Stoch Divergence Hints Bearish Move
This article is for general information purposes only. It is not investment advice or a solution to buy or sell securities. Opinions are the authors; not necessarily that of OANDA Corporation or any of its affiliates, subsidiaries, officers or directors. Leveraged trading is high risk and not suitable for all. You could lose all of your deposited funds.

Mingze Wu
Latest posts by Mingze Wu (see all)
- European Bourses Not Enjoying Bullish Winds From US Stocks - 17 April 2014
- More Aggressive Stimulus Possible Despite Premier Li’s Denial - 17 April 2014
- China March FDI -1.5% Y/Y vs +2.05% expected. First decline in more than a year. - 16 April 2014