Knock on something hard enough and it will eventually crack. There is a Chinese proverb: “水能穿石,人能搬山”, which literally translates to “water may pierce rocks, and man may move mountains”, illustrating the power of perseverance. In this case, the rock represent the stubborn 128.0 level that held firm even in aftermath of the FOMC event, which has now been comprehensively broken.
Hourly Chart
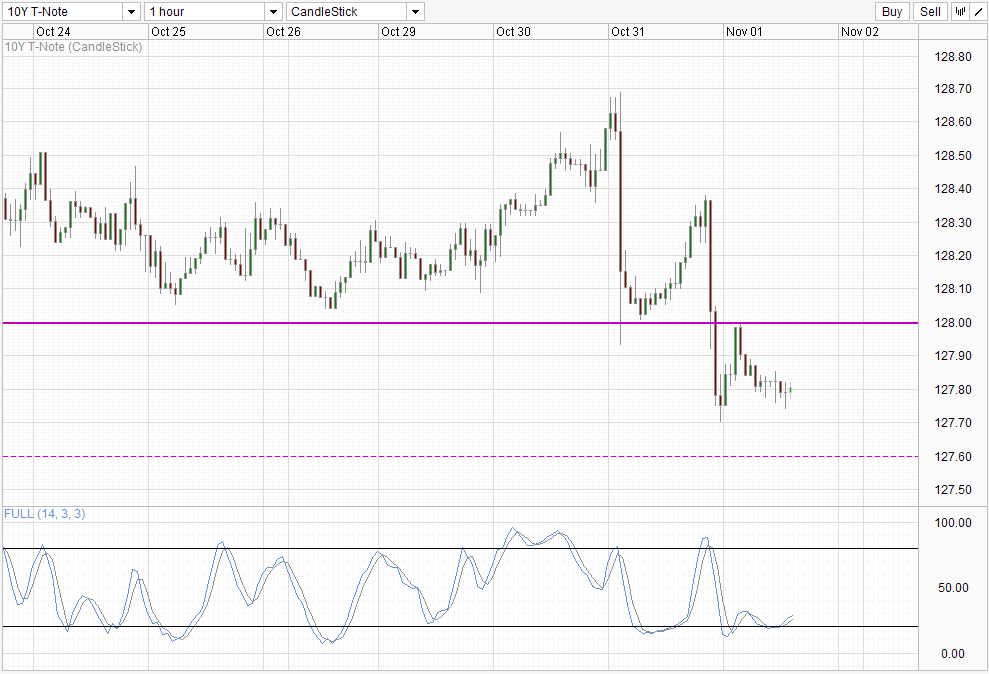
Bulls did put up a good fight though, pushing prices to close to 128.4 before US market opened. However, bears were on the move the moment US market opened, pushing price to as low as 127.7 before noon, with the post noon pullback unable to break the 128.0 barrier – a good confirmation for the 128.0 bearish breakout. Price action during Asian hours affirmed this bearish outlook, pushing lower towards 127.7 steadily.
That being said, it should be noted that a temporary bullish pullback can be expected considering that bearish momentum has slowed down significantly since. This is also seen via Stochastic indicator with Stoch curve pointing higher after forming a Bullish Cycle signal. As there hasn’t been any significant bullish response since the start of Asian decline, we are due for a short-term correction which increases the likelihood of a bullish push around 127.7.
Furthermore, the reason for the sharp decline seen during US hours yesterday continue to stay elusive. We could put 2 and 2 together and proclaim that the worse than expected Jobless Claims have sparked such a move, but that is not particularly convincing. The only reasonable explanation seems to be a sudden bout of technical bearish response when price hit the 128.3 – 128.4 soft ceiling. This is also not very convincing but at least it is coherent – as a weaker than expected Jobless Claims would have meant lower risk appetite -> Higher bond prices, or incite speculation that QE3 will stay longer -> Higher bond prices again.
Without strong fundamental reasons for declines, it becomes less likely that bearish follow-through can last long, increasing the possibility of 127.7 holding for now.
Weekly Chart
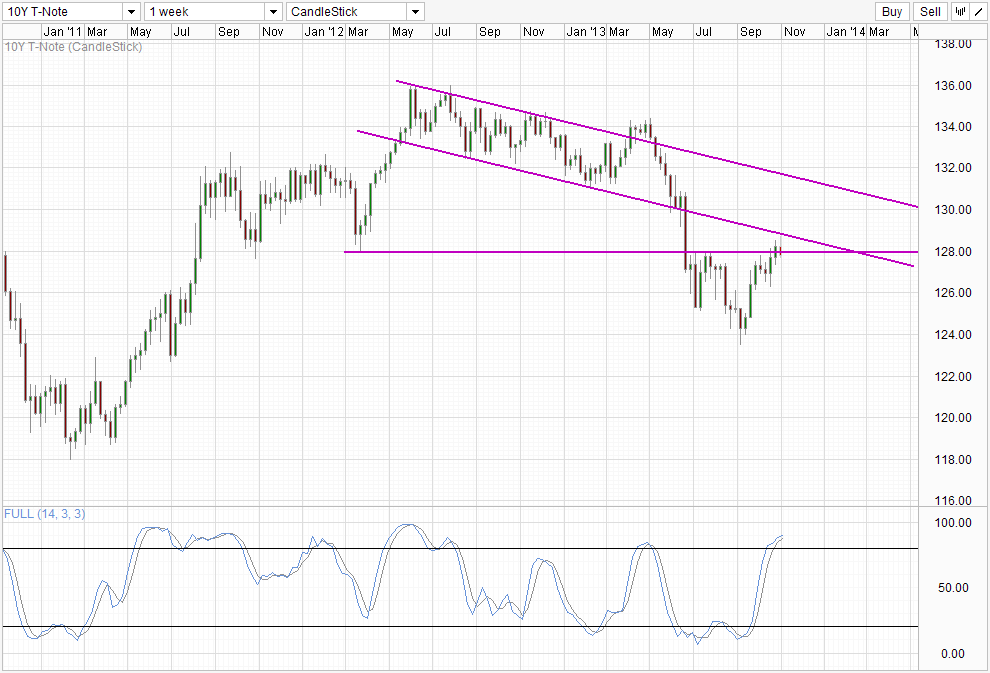
Long-term outlook is much more bearish than yesterday though, as the breach of 128.0 opens up a move to 124.0 and potentially below, which will bring implied yield above the key 3.0% mark. Stochastic readings also suggest that the recovery from September is overbought, making a bearish move from here likely – in line with long-term fundamentals which point to lower prices due to expected QE Taper/End in 2014 and rates hiking expected in 2015. With fundamentals lining up with technicals, a long-term bearish movement is possible, and all we need now is a show of bearish impetus in the short-run and the confirmation will be complete.
More Links:
S&P 500 Technicals – Mildly Supported But Long Term Bearish Reversal Lurks
Nikkei 225 – Gloomy Start For November
GBP/USD – Finds Support at 1.60
This article is for general information purposes only. It is not investment advice or a solution to buy or sell securities. Opinions are the authors; not necessarily that of OANDA Corporation or any of its affiliates, subsidiaries, officers or directors. Leveraged trading is high risk and not suitable for all. You could lose all of your deposited funds.

Mingze Wu
Latest posts by Mingze Wu (see all)
- European Bourses Not Enjoying Bullish Winds From US Stocks - 17 April 2014
- More Aggressive Stimulus Possible Despite Premier Li’s Denial - 17 April 2014
- China March FDI -1.5% Y/Y vs +2.05% expected. First decline in more than a year. - 16 April 2014