Despite the continued bearishness brought by the Debt Ceiling kerfuffle, WTI Crude remains broadly supported above 101.5. What is even more remarkable perhaps is the fact that prices should have been heavily bearish under 103.0, but it seems that traders did not receive the memo, sending prices higher on Monday. However, the gains were short-lived, with prices quickly pushing back down towards the 101.5 once again on Tuesday. It would be easy to simply attribute the gains/losses in the past 2 days as following the development of the Debt Ceiling resolution (in similar fashion to Gold), but it should be noted that current volatility in WTI was spotted few weeks ago, and did not increase just because we are nearer to the Debt Ceiling dateline of 17th October.
Hourly Chart
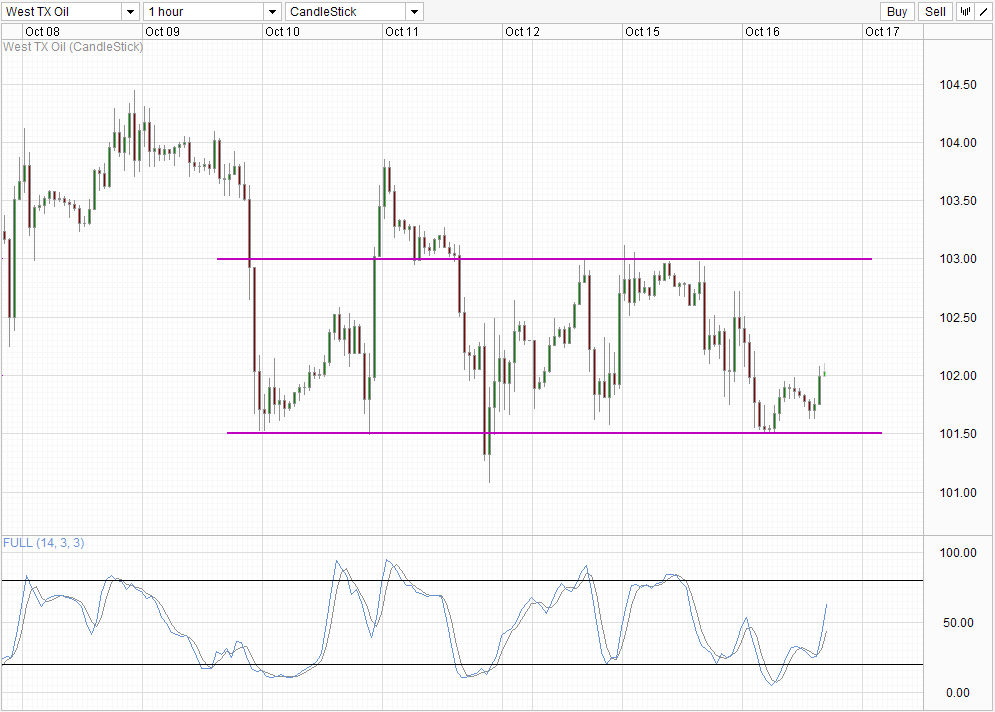
From a technical perspective, 103.0 is the immediate bullish target. Stochastic readings agree with stoch curve pointing higher and clearing above the 50.0 level – where previous peaks and troughs have been seen. 102.5 may provide interim resistance given that it has been the turning point for price since 10th October.
Weekly Chart
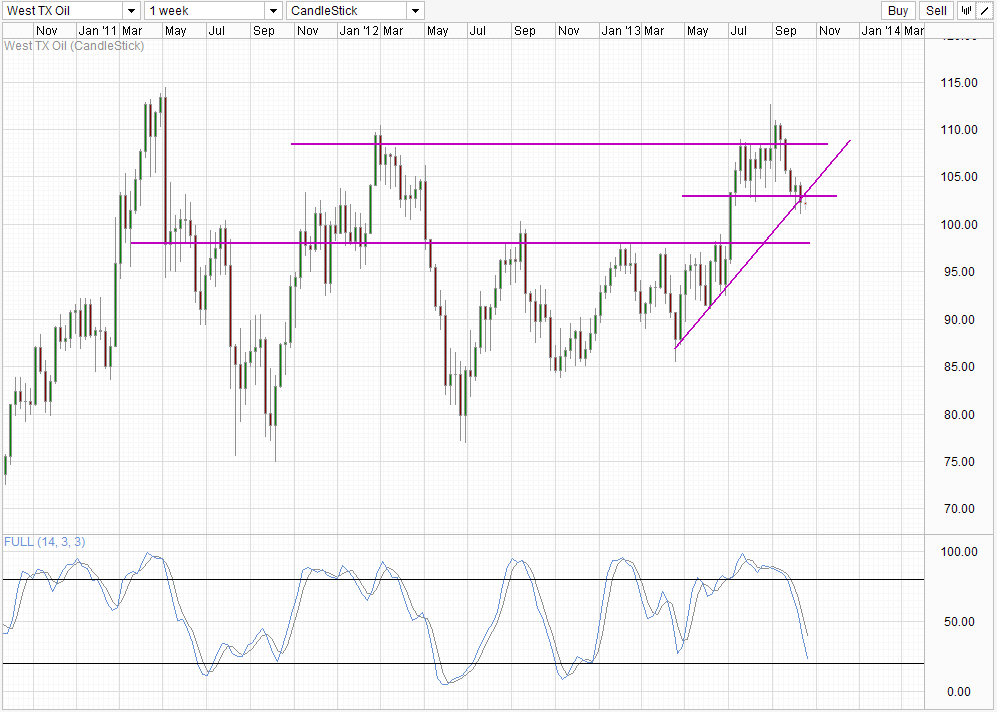
Weekly Chart is definitely bearish with prices not only breaking the 103.0 support but also trading below the rising trendline which represents the rally from April lows. Stochastic indicator favors continued bearish movement but it suggests that continued bearish push beneath 98.0 round figure may be less likely considering that Stoch readings are nearing Oversold region currently.
With the US Governmental shutdown, the Energy Information Administration will not be releasing its weekly inventory data today, hence it is unlikely that we have any fundamental reasons for Crude Oil to move today. The American Petroleum Institute (a private organization) will be publishing its weekly data at 4.30pm EDT, but market tended not to react vigorously towards API numbers even when they are way off analysts estimates. Hence we could expect further technical influences today which would mean a higher likelihood of 101.5 and 103.0 holding, if we even reach either levels today that is.
More Links:
USD/INR – Higher Despite USD Weakness
AUD/USD – Moves to Four Month High near 0.9550
EUR/USD – Relies Heavily on Support at 1.35
This article is for general information purposes only. It is not investment advice or a solution to buy or sell securities. Opinions are the authors; not necessarily that of OANDA Corporation or any of its affiliates, subsidiaries, officers or directors. Leveraged trading is high risk and not suitable for all. You could lose all of your deposited funds.

Mingze Wu
Latest posts by Mingze Wu (see all)
- European Bourses Not Enjoying Bullish Winds From US Stocks - 17 April 2014
- More Aggressive Stimulus Possible Despite Premier Li’s Denial - 17 April 2014
- China March FDI -1.5% Y/Y vs +2.05% expected. First decline in more than a year. - 16 April 2014