Gold prices rallied on open today following the political fiasco in US over the weekend. However, prices were not able to hold onto the gains, suggesting that the overall bearish pressure is huge even though short-term trend is bullish based on the recovery from last week’s 1,305 low.
Hourly Chart
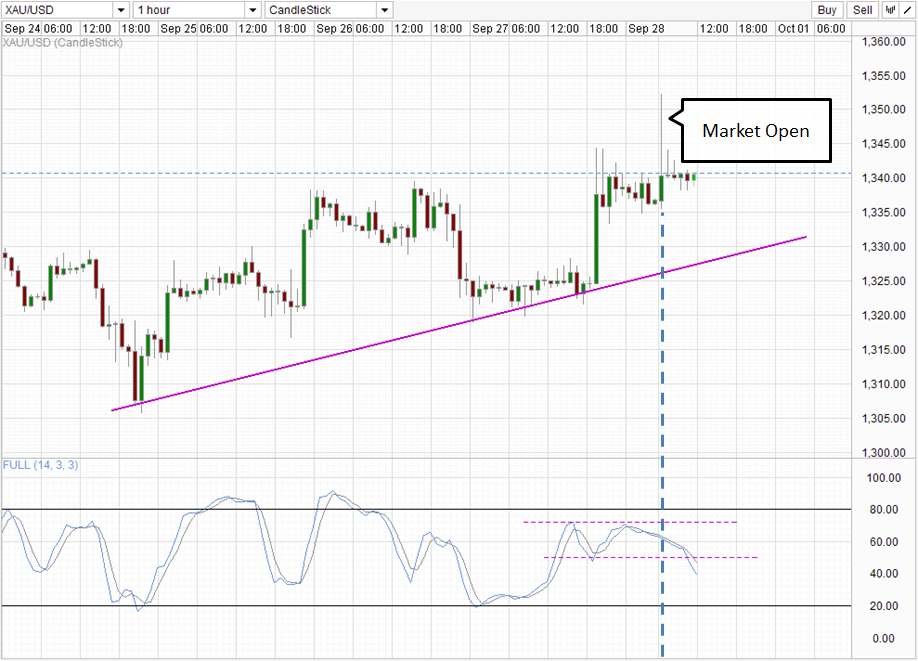
From a technical perspective, the failure to break 1,340 is bearish and opens up the ascending trendline as a possible bearish target. Stochastic agrees, with readings breaking the “support” level which was where the previous Stoch trough seen on last Friday. It is possible that prices will tag the rising trendline at around 1,330 if we descend moderately, which happens to be the confluence with the ceiling between 24-25th Sep and the floor of 26th Sep. Furthermore, 1,330 – 1,345 has been regarded as the resistance band seen on the weekly chart, and as such we can reasonably expect prices to find strong support from there. This is also echoed by Stochastic readings which will most likely be Oversold or close to the previous 2 major trough levels (see 24th and 27th Sep troughs), potentially generating a bullish cycle signal when prices hit the 1,330 mark. Nonetheless, because strong support is expected, should prices manage to break the 1,330/rising trendline confluence, the implication would be extremely bearish, and we could see strong bearish momentum pushing lower quickly.
Weekly Chart
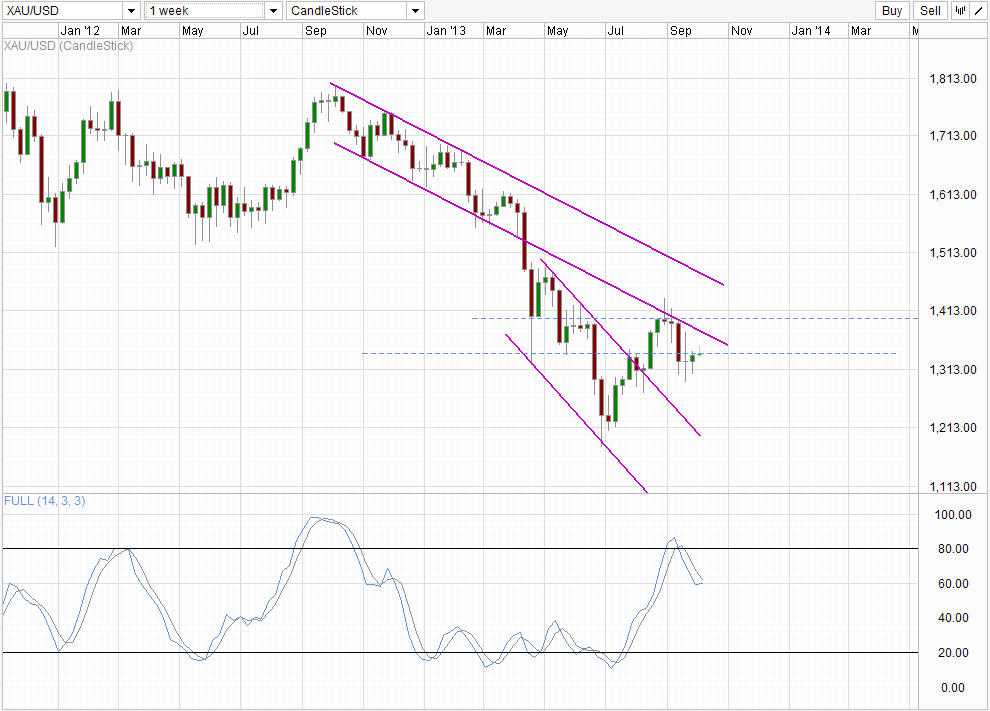
This potential strong bearish momentum is also hinted at from the Weekly Chart. Previous 2 weeks price action suggest that the initial bearish rejection from 1,400/Channel Bottom on the last week of August has stalled, with Stochastic readings flattening out. However, should prices manage to push below 1,330 and 1,300, the likelihood of bearish momentum reverting will be high and we could see potential acceleration towards Channel Top which is currently below 1,200. This may open up even lower bearish targets especially since 1,200 was the level where July – Sep recovery began.
Fundamentally, it is strange to see latest CFTC Commitment of Traders numbers net long positions have actually grew, breaking the streak of 3 consecutive weeks of decline. However, it should be noted that the numbers were taken from Tuesday, exactly where last week’s bullish recovery began. Therefore, this is by no means a confirmation that market is still bullish with 1,340 continue to hold firm. Instead, traders may wish to focus on this week’s numbers for a better gauge of speculative action. Should Net Long positions fall, coupled with prices breaking 1,330 by the end of this Tuesday, this may be a good indication that institutional speculators are favoring a longer term bear. Conversely, should prices actually break 1,340 (preferably above this morning’s swing high) with a higher Net Long positions, we will be in a better position for stronger bullish correction that may lead us to Channel Bottom of weekly chart which is around 1,360 – 1,370 next week.
More Links:
GBP/USD – Moves to new 2013 High around 1.6180
AUD/USD – Struggling to stay above Key 0.93 Level
EUR/USD – Feeling Pressure from Resistance at 1.3550
This article is for general information purposes only. It is not investment advice or a solution to buy or sell securities. Opinions are the authors; not necessarily that of OANDA Corporation or any of its affiliates, subsidiaries, officers or directors. Leveraged trading is high risk and not suitable for all. You could lose all of your deposited funds.

Mingze Wu
Latest posts by Mingze Wu (see all)
- European Bourses Not Enjoying Bullish Winds From US Stocks - 17 April 2014
- More Aggressive Stimulus Possible Despite Premier Li’s Denial - 17 April 2014
- China March FDI -1.5% Y/Y vs +2.05% expected. First decline in more than a year. - 16 April 2014